
Adjusting Pre-Game Models for Injury Risks
Integrate real-time injury data into pre-game models to adjust team ratings, estimate player availability probabilistically, and improve win, spread, and total forecasts.

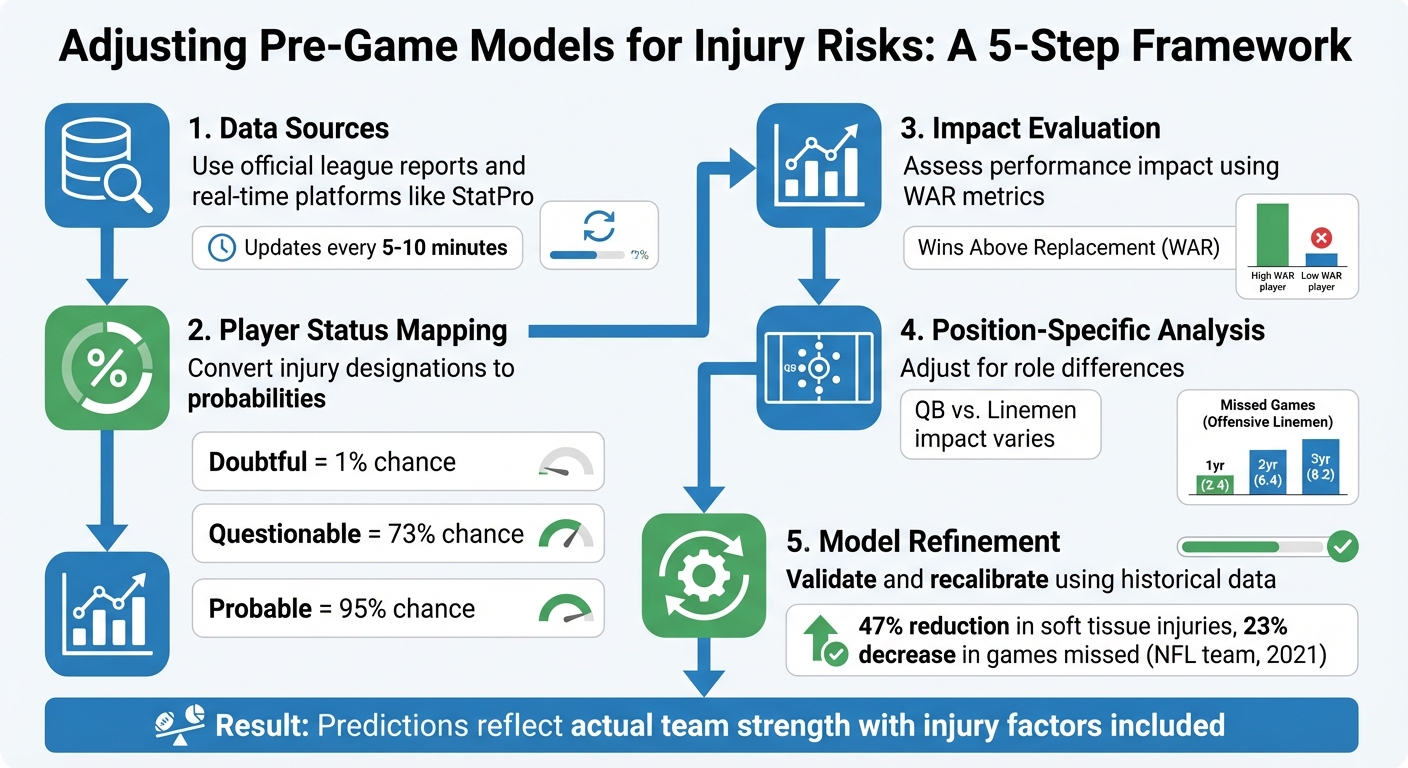
In sports forecasting, injuries can significantly alter game outcomes, yet many predictive models fail to account for this. By integrating injury data into pre-game models, analysts can improve win probability estimates, point spread predictions, and total score forecasts. Here's how it works:
- Data Sources: Use official league reports and real-time updates from platforms like StatPro for accurate injury tracking.
- Player Status Mapping: Convert injury designations (e.g., "Questionable" = 50% chance of playing) into measurable probabilities.
- Impact Evaluation: Assess how injuries affect team performance using metrics like Wins Above Replacement (WAR).
- Position-Specific Analysis: Adjust for differences in injury impact by player roles (e.g., quarterbacks vs. linemen).
- Model Refinement: Regularly validate and tweak models using historical data to improve accuracy.
This approach ensures predictions reflect actual team strength, factoring in injuries that influence game-day performance.
5-Step Framework for Integrating Injury Data into Sports Forecasting Models
[DSC 5.0] Machine Learning Driven Injury Prediction - Thomas Huijskens
Structuring and Preparing Injury Data for Integration
This section explains how to organize and prepare injury data for seamless integration into models, building on the earlier discussion about model adjustments.
Identifying Reliable Injury Data Sources
Accurate, up-to-date data is the backbone of injury-adjusted models. Start with official league sources like the NFL, NBA, MLB, and NHL, which provide direct, authoritative injury updates from teams. But these reports often leave out important details. That’s where credible media outlets come in - they help fill in the blanks, especially for injuries that occur during practices or pre-game warmups.
"Credible media reports are also used to ensure we are up to date." - SportsDataIO
Timeliness is key. High-quality data sources refresh every 5 to 10 minutes, capturing last-minute changes. Some critical times to watch include NFL practice reports at 4:00 PM and updates released 90 minutes before kickoff. Tools like StatPro (https://statpro.io) are particularly helpful, offering real-time injury updates with timestamps and detailed status information. Additionally, the NFL has partnered with independent firms like IQVIA since 2015 to ensure their injury data is accurate and reliable for health and safety research.
Once you’ve identified dependable data sources, the next step is transforming this raw data into actionable insights for your models.
Transforming Injury Data into Model-Ready Features
To make raw injury data useful, start by converting player statuses into measurable variables. One common approach is mapping official injury designations to probability values. For example, "Doubtful" corresponds to a 1% chance of playing, "Questionable" to a 73% chance, and "Probable" to 95%. This method offers more precision than simple "in" or "out" labels.
You’ll also want to quantify injury severity and workload patterns. For severity, calculate the Injury Burden, which tracks days lost per 100 player-matches. To assess workload, use the ACWR (Acute:Chronic Workload Ratio). This involves dividing the average workload over the past 5–7 days by the average over the last 28–30 days. Ratios above 1.0 indicate a higher risk of injury. Other historical metrics, like the total number of past injuries or the time since a player returned to full training, are also crucial for predicting re-injury risks.
Quantifying Player Impact and Team-Level Aggregates
Once individual injury data is processed, the next step is to evaluate its impact on team performance. This involves aggregating individual metrics to understand the broader team dynamics. A key tool for this is the WAR-Adjusted Injuries Lost (WAIL) framework. This method calculates the impact of an injury by adjusting a player’s projected Wins Above Replacement (WAR) based on their injury status.
For example, in Week 6 of the 2020 NFL season, the Dallas Cowboys lost quarterback Dak Prescott, which added +0.14 WAR to their total injuries lost, reflecting the significant impact on their roster. Similarly, when the Cincinnati Bengals lost rookie quarterback Joe Burrow to a knee injury that same year, their WAIL increased by 0.78.
Position also plays a major role in these calculations. Offensive linemen, for instance, are forecasted to miss the most games over one-, two-, and three-year spans (2.4, 6.4, and 8.2 games, respectively), followed by offensive skill players and defensive players. To get a team-level view, sum up the projected WAR of all injured players, weighted by their likelihood of missing the game. This gives you a single "total value at risk" metric that can be directly incorporated into pre-game models.
Integrating Injury Risks into Pre-Game Models
Using injury data effectively in your pre-game forecasting can make a significant difference in how you assess team strength, player availability, and overall outcomes. Here's how to blend injury insights into your model for better predictions.
Adjusting Team Ratings for Injuries
To account for injuries, adjust team ratings by evaluating the performance gap between a starter and their replacement. Metrics like Total Points per Snap, Snap %, and Projected Snaps are particularly useful for this analysis. For example, in September 2025, Sports Info Solutions introduced a multi-year injury risk model leveraging XGBoost to predict games missed by NFL players. This model utilized features like "Snap % in the Slot" and "Blown Block %" to determine injury risks. For offensive skill players, factors such as "Age" and "Total Points per Snap" emerged as key predictors of time lost due to injuries over a three-year period.
It’s also important to weigh injuries by position. Offensive linemen, for instance, tend to miss more games over multiple seasons compared to other positions.
"The more a player is on the field, the more he invites risk of getting injured." - Chris Lee, Sports Info Solutions
Incorporating Probabilistic Availability Modeling
Instead of treating player availability as a simple yes-or-no scenario, consider applying probabilistic weights to reflect the uncertainty of their participation. For instance, you can assign probabilities to official injury designations: "Doubtful" corresponds to a 25% chance of playing, "Questionable" to 50%, and "Probable" to 75%. This approach allows for a more nuanced integration of injury data into your model.
To refine these estimates, use survival analysis techniques like Kaplan-Meier or Cox models, which factor in variables such as age, position, and workload. Temporal Point Processes can also help model injury clusters. A study of MLB injuries demonstrated that this method reduced uncertainty in predicting injury timing from a 162-day RMSE (based on the naive average) to 144 days.
Enhancing Outcome Models with Injury Features
Once you’ve adjusted team ratings and estimated player availability, the next step is to incorporate injury-related features into your outcome models. Features like Injury Burden, ACWR (Acute:Chronic Workload Ratio), and past injury counts can help your model identify patterns that influence game results.
Position-specific metrics are also crucial. For offensive skill players, factors like "Snap % in the Slot" and "Snaps Blocking" carry significant weight. Offensive linemen metrics, such as "Snap % Playing Tackle" and "Projected Snaps", are more relevant for their roles. Defensive players, on the other hand, are often evaluated using "Age" and "Total Points per Snap". Splitting your dataset by position group can help capture these specific dynamics more effectively.
For real-time updates, tools like StatPro (https://statpro.io) provide live injury data with timestamps and status details. Since NFL injury reports are updated constantly, integrating this real-time information ensures your forecasts stay accurate and reflect the latest roster conditions.
Validating and Refining Injury-Adjusted Models
Fine-tuning your injury adjustments requires consistent testing and recalibration to align with changing injury trends.
Backtesting Injury-Adjusted Forecasts
To validate your model, backtest it against historical game data and compare its forecasts to actual outcomes. The goal is to outperform simple benchmarks, like a "no injury" forecast or basic historical averages.
Use spreadsheet filters to pinpoint areas where the model falls short - whether it’s specific leagues, odds ranges, or game types - and refine those weak spots. Track key performance metrics like AUC, sensitivity, and RMSE to measure accuracy. For example, a binary classification model predicting NBA knee injuries achieved an AUC of 0.75 and sensitivity above 0.6.
Once backtesting is complete, dive into the errors to identify where the model struggles most.
Error Analysis for Injury-Related Forecasts
Error metrics are crucial, especially since injury data is often imbalanced. Injuries can be rare events; for instance, in elite soccer datasets, injuries occur in just 2% of cases, leaving 98% as non-injury examples. This imbalance can make standard accuracy metrics misleading. One NFL injury prediction model, for example, reported 83% accuracy but only 43% precision and 23% recall - revealing that while overall accuracy appeared high, many actual injuries were missed. Focusing on metrics like precision, recall, and F1 scores helps ensure your model accurately captures injury impacts.
Be cautious of common pitfalls, such as data leakage. Overlapping training and test sets can inflate performance, especially when using rolling averages for workload metrics. For instance, if day n and day n+1 data are nearly identical, failing to split data chronologically can lead to artificially high results. Another frequent oversight is underestimating the role of day-to-day (DTD) injuries, which often drive immediate risks more than formal Injured List stints. For survival models, check Schoenfeld residuals to confirm the proportional hazards assumption holds; violations here could indicate risk miscalculations over time.
Armed with these insights, recalibrate your model to adapt to evolving injury patterns.
Recalibrating Injury Impact Over Time
Injury patterns are not static - they shift due to factors like load management, changes in medical protocols, and evolving recovery strategies. Regular updates to injury impact parameters are essential. Tools like stratified Cox Proportional Hazards or baseline hazard functions can help account for seasonal fluctuations. For example, Liverpool FC saw their median injury-free period drop from 265 days in the 2017/2018 season to just 106 days in 2018/2019.
To better reflect recent trends, consider using Exponentially Weighted Moving Averages (EWMA) for workload features instead of simple rolling averages. This method assigns greater weight to recent data, making it more responsive to current recovery patterns. For self-exciting models, which track how past injuries increase future risks, regularly updating the decay parameter ensures the model stays aligned with advancements in medical care and recovery practices. Additionally, recalibrating for position-specific differences is essential. For instance, offensive linemen tend to miss more games than other players, and older athletes may show signs of retirement that require manual adjustments.
Operationalizing Injury-Adjusted Pre-Game Models
Turning injury-adjusted models into actionable tools requires setting up automated systems to handle real-time injury updates.
Automating Injury Data Processing
The backbone of any injury-adjusted model is an automated pipeline that pulls injury data every 5 to 10 minutes throughout the day. This frequent querying ensures you’re capturing updates from official league reports and reputable media sources as they emerge. Tools like StatPro are particularly useful, offering real-time injury updates for leagues like the NFL, NBA, and MLB, which simplifies the data collection process.
Pay special attention to updates after 4:00 PM practice reports and in the critical 90 minutes before kickoff. These windows often see the most significant changes in player availability.
Once the raw data is collected, it needs to be cleaned and standardized before feeding into your model. This involves aligning player IDs, injury dates, and recovery timelines with exposure metrics like minutes played. It's also crucial to distinguish between InjuryStatus fields (e.g., Questionable, Doubtful, Out) and roster Status fields (e.g., Active, Inactive). For example, in the NFL, a player listed as "Out" under InjuryStatus but still marked "Active" on the roster requires additional attention to confirm their official game-day status.
This automated pipeline is the foundation for generating accurate pre-game forecasts.
Pre-Game Forecasting Workflow
Accurate injury data is essential for adjusting team performance metrics based on player availability. Start by generating baseline forecasts to serve as a comparison point. Then, pull the latest injury updates from your pipeline and map player statuses to their likelihood of participating. For example, in the NFL, a "Doubtful" tag almost always means the player will miss the game, while "Questionable" requires closer monitoring.
Next, apply injury impact parameters to fine-tune team ratings or outcome probabilities. For survival-based models, use the intensity function to estimate how recent injuries might influence current risk levels. For count-based models, adjust performance metrics based on the cumulative impact of injured players. Take note of specific player status changes - like a star quarterback moving from "Questionable" to "Out" - and document how these shifts affect your predictions, such as win probabilities or point spreads.
These adjustments should be made at least twice on game day: once after morning practice reports and again during the 90-minute pre-game window when final roster decisions are announced.
Monitoring and Maintaining Model Performance
Once forecasts are generated, continuous monitoring is key to ensuring accuracy and reliability.
Evaluate your model’s performance separately for games with high injury rates versus those with fewer injuries. This helps determine whether your injury adjustments are improving predictions or introducing unnecessary noise. Metrics like AIC (Akaike Information Criterion) and BIC (Bayesian Information Criterion) can help you compare how well different statistical models - such as Poisson versus Negative Binomial - capture injury-related trends.
For survival models, check Schoenfeld residuals regularly to confirm that the proportional hazards assumption holds true. If it doesn’t, consider stratifying your model or exploring alternative methods.
Also, monitor performance by position. In MLB, for instance, pitchers and batters have distinct injury risk patterns, and your model should account for these differences. Position-specific insights can significantly refine your overall predictions.
Conclusion
Incorporating injury risks into pre-game models is reshaping sports forecasting by moving from a reactive mindset to a proactive strategy. A striking example comes from an NFL team that adopted AI-powered injury prediction in 2021. The results? A 47% drop in soft tissue injuries and a 23% decrease in games missed - all within a single season. These advancements translate to more dependable forecasts and better team management.
Think of your models as living systems that need to adapt as new injury data becomes available. Regular updates ensure your predictions remain accurate throughout the season. As Owais Akbani, a Data Consultant, aptly stated:
"A simple, interpretable model that helps a coach optimize player rotations or prevent injuries is often more powerful than an overly complex system that's never applied." – Owais Akbani
Tools like StatPro make this process more efficient by centralizing real-time injury updates and performance metrics. By automating data collection and integration, you can eliminate tedious manual tracking and concentrate on refining your forecasting methods.
This approach not only sharpens predictions but also boosts competitive performance. Teams and analysts who incorporate injury-adjusted data gain a clear edge, maintaining consistent performance throughout the season - a factor closely tied to higher success rates. By using automated data pipelines and validating models regularly, you're crafting forecasts that reflect real-world conditions, ensuring player availability is factored into every decision. This continuous refinement cements a team's competitive advantage.
FAQs
How does using injury data improve pre-game predictions?
Incorporating injury data into pre-game models improves accuracy by transforming uncertainties about player availability into actionable insights. By examining elements like the risk of missed games, historical injury trends, and workload metrics, these models can offer a clearer picture of player performance and overall team outcomes.
Using advanced tools like machine learning and event-based modeling, analysts can uncover patterns such as recurring injuries or clusters that traditional statistics might miss. Platforms like StatPro further enhance this process by delivering real-time updates on player health, ensuring predictions are always based on the most current information. This approach makes forecasts more dependable for teams, bettors, and fans.
What are the most important metrics for evaluating the impact of player injuries?
When considering player injuries in pre-game predictions, the key is to focus on metrics that reveal how often injuries happen, their seriousness, and how much time players spend off the field. Here’s what matters most:
- Injury incidence rate: This measures how frequently injuries occur, typically calculated as the number of injuries per 1,000 minutes or games played.
- Days and games missed: Tracks the total time a player is out due to injury, recorded either in calendar days or the number of games missed.
- Severity levels: Injuries are grouped into categories such as minor (less than 7 days), moderate (7–21 days), or severe (over 21 days) to gauge their impact on team performance.
- Injury type and location: Knowing the specific nature and location of an injury (e.g., lower-body strains) helps predict recovery time and assess the risk of it happening again.
- Recurrence rate: This indicates how likely a player is to re-injure the same area during the season, offering insights into their long-term reliability.
StatPro makes this analysis easier by delivering real-time data on these metrics, allowing you to sharpen your predictions with precise, actionable information.
How do real-time injury updates improve pre-game predictions?
Real-time injury updates are a game-changer for pre-game predictions, ensuring your model stays up-to-date with the latest player availability. By factoring in fresh injury data right before the game, you can fine-tune player participation probabilities, adjust performance expectations, and refine lineup choices for more precise forecasts.
To make the most of this data, consider subscribing to a live injury feed that refreshes frequently. Map injury statuses - like Injured, Doubtful, or Questionable - directly to your model's inputs, and recalculate player probabilities accordingly. Running your model just before the game allows you to account for last-minute updates, enabling you to deliver sharper, more reliable insights to your audience.