What Do Advanced Baseball Metrics Actually Mean?
Explore advanced baseball metrics like WAR, wOBA, and FIP, and learn how they shape player evaluation and team strategies in the game.

Baseball has evolved far beyond basic stats like batting averages and RBIs. Advanced metrics now dominate the game, offering deeper insights into player performance, team strategies, and decision-making. These stats help teams understand why certain outcomes occur, separate skill from luck, and make smarter roster decisions. Metrics like WAR, wOBA, FIP, and wRC+ have become essential tools for evaluating players, planning games, and developing talent.
Here’s a quick summary of key metrics covered:
- WAR (Wins Above Replacement): Measures a player's total contribution to their team compared to an average replacement player.
- wOBA (Weighted On-Base Average): Values offensive outcomes like home runs and walks more accurately than traditional stats.
- FIP (Fielding Independent Pitching): Focuses on a pitcher’s performance, ignoring external factors like defense.
- wRC+ (Weighted Runs Created Plus): Adjusts offensive stats for ballpark and league factors, making comparisons fairer.
Advanced metrics have changed how teams scout, negotiate contracts, and even position fielders. Platforms like StatPro make these insights accessible to fans and analysts, offering real-time stats and tools to analyze the game like the pros. While these stats are powerful, they must be used carefully, considering context like ballpark effects, weather, and sample sizes.
Baseball Statistics Explained (OPS, WAR, FIP, etc.)
Key Advanced Metrics Explained
Modern baseball analysis thrives on advanced metrics, offering deeper insights into player performance and team strategies. Here’s a breakdown of some of the most impactful statistics shaping the game today.
WAR (Wins Above Replacement)
WAR is a go-to metric for evaluating a player's overall contribution to their team. It boils down to one question: How many more wins does this player bring compared to a readily available replacement, like a Triple-A call-up?
This stat is particularly handy because it allows direct comparisons across positions. Whether it’s MVP debates, Hall of Fame decisions, or contract talks, WAR plays a pivotal role. It combines three key elements: offensive production, defensive skills, and positional value, all measured against a baseline replacement-level player - someone who might hit .230 with average defense.
The scale of WAR helps contextualize performance. A 2.0 WAR season signals a solid starter, while a 6.0+ WAR season is MVP territory. Anything beyond 8.0 WAR? That’s the stuff of legends, happening maybe once or twice a year across all of baseball.
wOBA (Weighted On-Base Average)
Unlike traditional batting average, which treats all hits equally, wOBA assigns proper value to different offensive outcomes. For example, a home run counts significantly more than a single, and even walks and hit-by-pitches are credited for their role in generating runs.
wOBA is scaled like on-base percentage, so it’s easy to interpret: a .320 wOBA is league-average, while .400+ indicates elite performance. Typically, weaker hitters hover around .280, and the best offensive players can push past .450.
What makes wOBA especially useful is its ability to predict future performance. It also adjusts for park and league factors, ensuring fair comparisons. A .380 wOBA in a hitter-friendly park, for instance, doesn’t carry the same weight as the same number in a pitcher-friendly environment.
FIP (Fielding Independent Pitching)
FIP zeroes in on the events a pitcher can control - strikeouts, walks, hit batters, and home runs - while filtering out external factors like defense, luck, or ballpark quirks. It’s designed to show a pitcher’s "true" performance.
Since FIP is scaled like ERA, it’s easy to interpret. A 3.50 FIP suggests a pitcher performed at a level consistent with a 3.50 ERA, regardless of what their actual ERA says. Large gaps between ERA and FIP often point to external influences. For example, a pitcher with a 4.20 ERA but a 3.40 FIP might have suffered from poor defense, while a 3.10 ERA paired with a 4.00 FIP could indicate strong defensive support.
Though FIP assumes league-average rates for home runs and balls in play, it’s a reliable tool over larger sample sizes, even if it doesn’t fully account for a pitcher’s ability to induce weak contact.
wRC+ (Weighted Runs Created Plus)
wRC+ takes offensive contributions and translates them into runs, adjusting for factors like ballpark dimensions and league averages. A score of 100 represents league-average production, while a 130 wRC+ means a player created 30% more runs than the average hitter.
This metric is invaluable for comparing players across different eras or environments. For instance, it allows meaningful comparisons between Babe Ruth’s 1927 season and Mike Trout’s 2012 campaign. Teams also lean on wRC+ during contract negotiations and trades, as its run-based foundation helps tie offensive output to on-field success and financial value.
Additional Metrics: BABIP, ISO, and Statcast Data
- BABIP (Batting Average on Balls in Play): This measures what happens when a batter puts the ball in play. The league average hovers around .300, so deviations can hint at luck or skill. A high BABIP might reflect a hitter’s speed or ability to drive the ball hard, while a low BABIP could point to bad luck - or a pitcher benefiting from strong defensive support.
- ISO (Isolated Power): By subtracting batting average from slugging percentage, ISO highlights a hitter’s raw power. Values range from .000 (no extra-base hits) to .400+ for top-tier sluggers. For example, a .280 hitter with a .180 ISO is likely a contact hitter with moderate power, while a .240 hitter with a .280 ISO sacrifices some contact for impressive slugging.
- Statcast Data: Tools like exit velocity and launch angle provide a deeper look into player performance. Statcast also offers "expected" stats, which can reveal whether a player’s results are influenced by luck. This data is a game-changer for evaluating potential adjustments or predicting future outcomes.
These advanced metrics not only enhance our understanding of the game but also provide teams and fans with actionable insights into player performance and team-building strategies.
How Teams Apply Advanced Metrics
Baseball front offices have completely redefined how they approach building teams, planning games, and nurturing talent. By diving deep into advanced metrics, they make high-stakes decisions that can shape careers and influence the game itself.
Player Evaluation
Advanced metrics allow teams to spot hidden gems - players whose potential goes unnoticed in traditional stats. For example, a hitter with a high walk rate or a pitcher with strong strikeout numbers might be undervalued if their conventional stats don’t tell the full story.
When it comes to contract negotiations, these metrics are game-changers. Stats like wRC+ (Weighted Runs Created Plus) and WAR (Wins Above Replacement) help teams calculate a player’s true worth. Players with flashy traditional stats but weak advanced metrics might receive lower offers. On the other hand, those with strong underlying numbers can command higher salaries.
Trades also hinge on these advanced tools. Teams use metrics like FIP (Fielding Independent Pitching) and BABIP (Batting Average on Balls in Play) to predict future performance. This helps them avoid overpaying for players who may be due for a decline while identifying undervalued players who could improve.
But advanced metrics don’t stop at individual evaluations - they also shape how teams approach the game.
Team Strategy and Game Planning
Armed with advanced data, teams have transformed their strategies and game-day decisions to maximize their chances of winning.
Defensive positioning is now a science. Using spray charts and contact data, teams position their fielders based on where each batter is likely to hit the ball. For some teams, defensive shifts are used in over 40% of plate appearances, showing just how deeply ingrained this strategy has become.
Pitching matchups have evolved far beyond the old lefty-righty logic. Teams analyze how pitchers perform against specific hitter tendencies. For instance, if a pitcher struggles against pull hitters, they’ll avoid facing a left-handed batter who excels at pulling inside fastballs, even if traditional wisdom suggests otherwise.
Lineup construction is no longer about simple roles like putting the fastest player first or the best hitter third. Teams now analyze on-base percentages, situational hitting, and base-running metrics to build lineups that maximize scoring opportunities. Some teams have abandoned conventional lineup roles altogether, focusing instead on ensuring their best hitters get the most at-bats.
Bullpen management has also become more strategic. Relievers are deployed based on leverage situations and matchups rather than rigid roles. For example, a closer might be brought in during the eighth inning if the opposing team’s best hitters are at the plate, rather than saving them for a less critical ninth inning.
Player Development
Advanced metrics are just as crucial in developing talent, helping players refine their skills and tracking their progress over time.
Hitting development now revolves around data like exit velocity, launch angle, and swing decisions. Coaches work with players to adjust their swing mechanics for better contact or to improve their plate discipline. Even if a player’s batting average hasn’t improved, metrics like harder contact can signal progress.
Pitching development focuses on metrics like spin rate, command, and pitch tunneling. Young pitchers are trained to improve their control by targeting specific areas of the strike zone. Spin rate data helps them fine-tune the effectiveness of their breaking pitches, while command metrics ensure they’re consistently hitting their spots.
Minor league evaluation has also embraced advanced stats. A prospect might have average traditional stats but show excellent plate discipline or hard contact rates that point to future success. Development teams use this data to identify which skills will translate to the majors and tailor coaching accordingly.
Injury prevention is another area where metrics shine. By tracking biomechanical data and workload metrics, teams can monitor pitch counts, arm stress, and movement patterns to reduce injury risks. This approach helps protect players’ long-term health while ensuring they’re available to contribute on the field.
As new data sources and analytical tools continue to emerge, teams that successfully blend these insights with traditional scouting methods gain a real edge in building competitive, winning rosters. Advanced metrics aren’t just a tool - they’re transforming how the game is played and managed.
Context and Limitations of Baseball Metrics
Advanced baseball metrics offer a wealth of information, but they’re not the whole story. To make accurate evaluations and avoid missteps, it’s crucial to understand their limitations and the context in which they’re applied.
Context Matters in Baseball Metrics
Metrics in baseball don’t exist in a vacuum - they’re shaped by external factors that can significantly alter their meaning. One of the biggest influences is ballpark dimensions. For example, Coors Field, with its high altitude, allows balls to travel roughly 9% farther than at sea level. This means player stats from Coors Field need to be adjusted when comparing them to those from other parks.
Another critical factor is the league-wide offensive environment, which can change over time. Take the "steroid era" of the mid-1990s to mid-2000s, when home run rates were much higher than in other periods. A player hitting 35 home runs in 2019 achieved something more impressive than someone reaching the same number in 1999, when offense was inflated across the board.
Weather conditions also play a role. Cold weather can reduce how far a baseball travels, while humidity can affect the movement of pitches, like curveballs. A pitcher’s ERA in chilly April games at 40°F tells a very different story than their performance in warm September games at 85°F.
Timing within a season matters, too. Metrics from the first month of play are far less reliable than those collected over a full 162-game season. These examples highlight why it’s essential to interpret metrics with care and consider the broader context.
Common Limitations and Mistakes
One of the most frequent errors in baseball analysis is relying on a single metric to make judgments. For instance, WAR (Wins Above Replacement) provides a helpful overview but shouldn’t be the sole factor in evaluating a player.
Small sample sizes are another trap. Early-season stats or numbers from young players can be misleading without enough data. For hitters, metrics typically need at least 200–300 plate appearances, and for pitchers, 50–70 innings, to become reliable. Additionally, ignoring defensive context can skew evaluations. Players in different defensive systems will produce varying stats, often influenced more by their surroundings than their actual abilities.
There’s also survivorship bias, which can make long-standing veterans’ numbers look better than they are. Players who remain in the league tend to be the most successful from their draft classes, making their career stats seem more impressive when compared to younger, less-proven players.
Finally, injuries and health issues are often invisible in advanced metrics but have a massive impact on performance. A pitcher battling minor shoulder inflammation might maintain their velocity but lose command, leading to poor results that raw stats won’t fully explain. Recognizing these pitfalls is essential for accurate analysis.
Best Practices for Using Metrics
Given these limitations, the best approach is to use a combination of metrics rather than relying on just one. For example, when evaluating a hitter, look at their wOBA for overall offensive value, but also check their strikeout rate, walk rate, and hard-hit percentage to understand the skills driving their performance.
Trend analysis is another valuable tool. If a player’s exit velocity has been declining over several seasons, it could signal the early stages of aging, even if their traditional stats still look solid.
Always apply park and league adjustments when comparing players in different environments. Metrics like wRC+ and ERA+ account for these factors, making them more reliable for cross-team comparisons than raw numbers.
Combining metrics with scouting observations provides a fuller picture. A pitcher might have excellent stats, but scouts could notice subtle changes in their mechanics that hint at future struggles before those changes show up in the numbers.
Understanding how metrics are calculated is equally important. For instance, BABIP measures luck and defensive quality, not hitting skill. A low BABIP might suggest a hitter is due for better results, rather than indicating poor performance.
Lastly, consider a player’s role within their team. A reliever’s stats might look worse because they’re used in high-pressure situations, while another pitcher’s numbers benefit from working in less stressful scenarios.
Metrics are powerful tools, but they’re not definitive answers. By interpreting them thoughtfully and in context, analysts can gain deeper insights into player performance and team strategy, making analytics an indispensable part of the game.
How StatPro Supports Baseball Analytics
As advanced metrics continue to transform baseball, StatPro steps in to provide the tools needed to make sense of these insights. By offering a detailed analytics platform, StatPro empowers fans, analysts, and organizations to dive deeper into the game.
StatPro Features
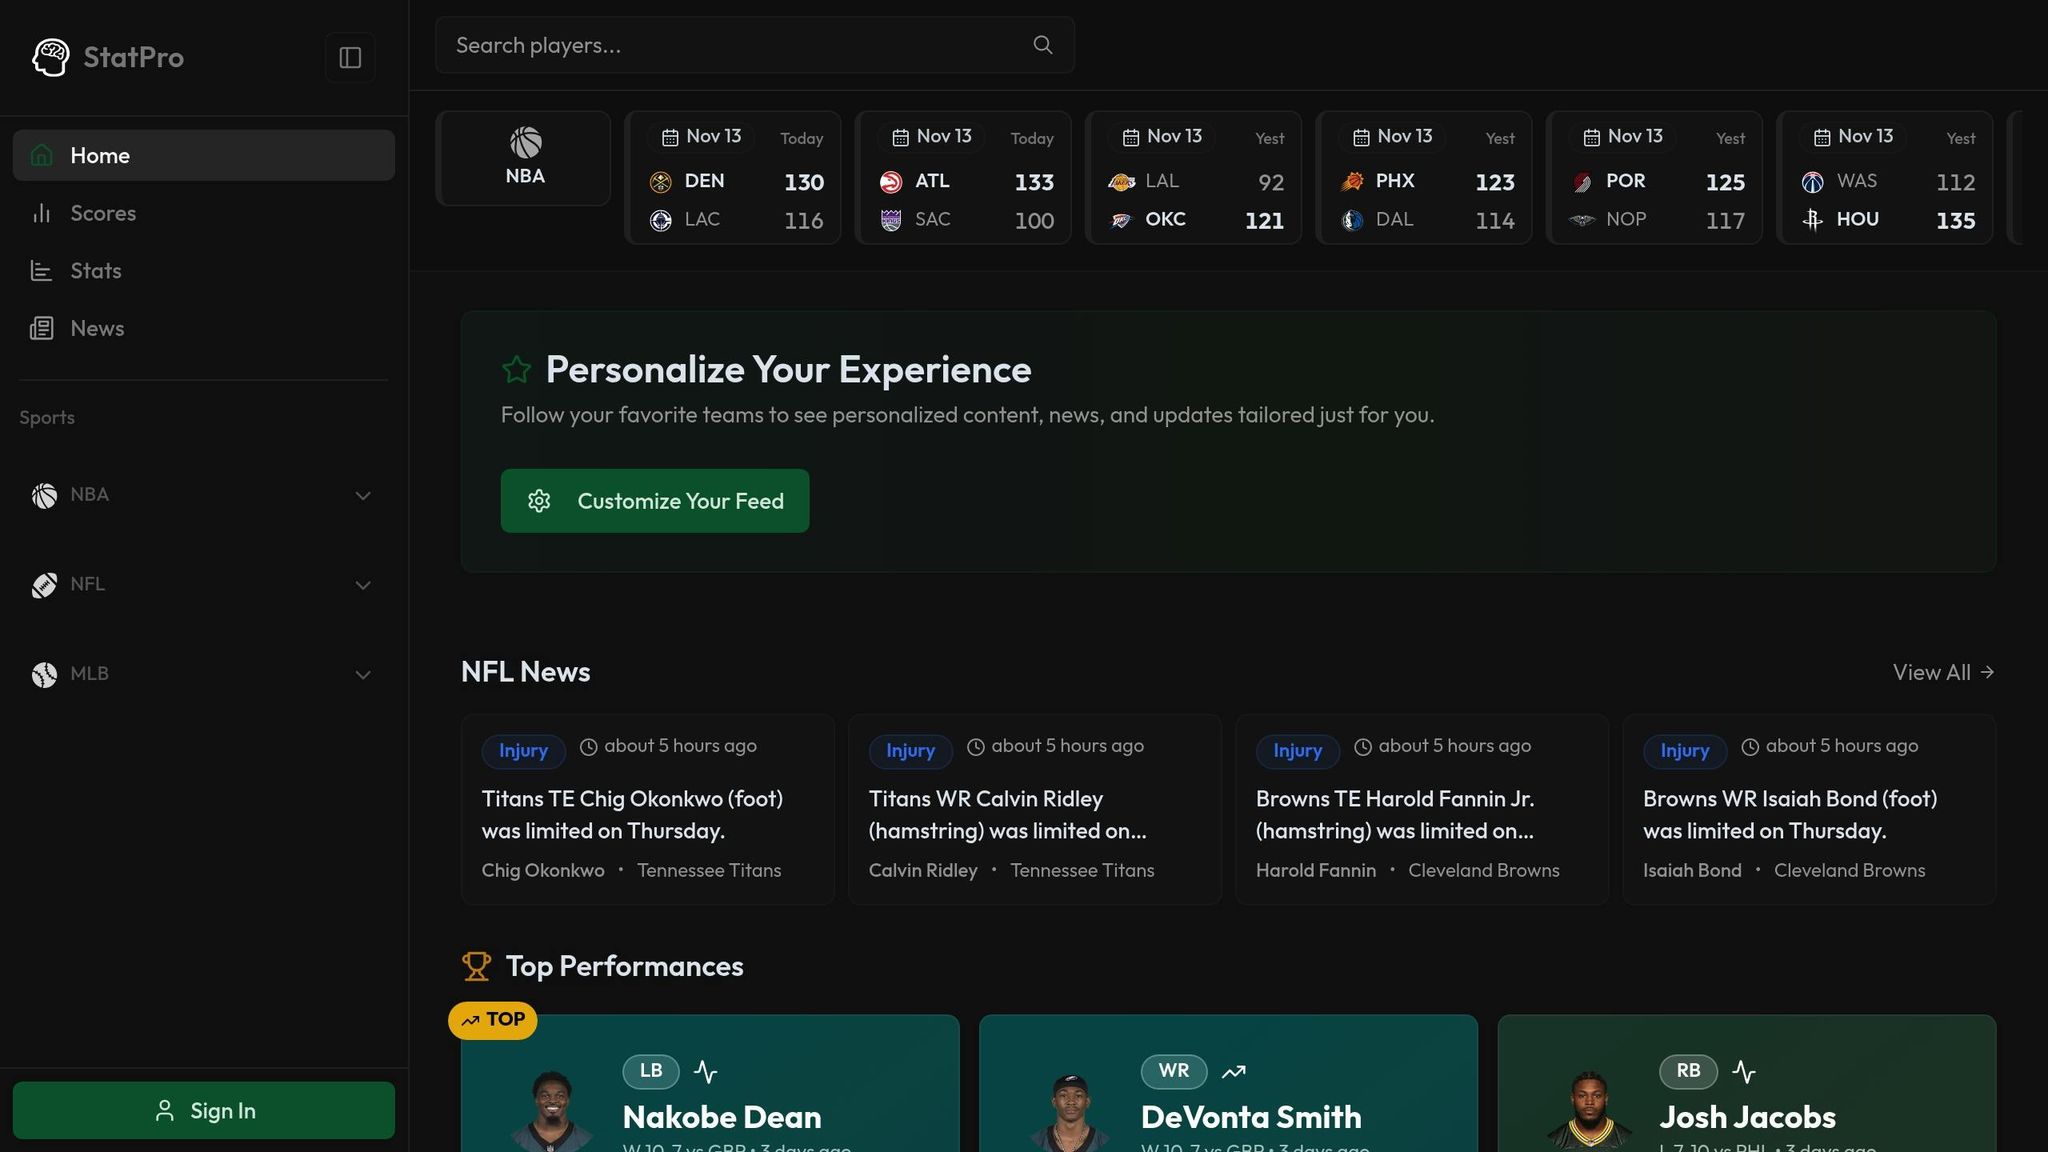
StatPro delivers real-time MLB stats through an easy-to-use dashboard that highlights key performance indicators. This allows users to track player performance trends and access critical statistics without delay. The platform also includes features like custom reports, timely injury updates, and transaction news - keeping users updated on factors that could influence team performance.
Pricing Plans
StatPro offers three pricing options tailored to suit varying needs and budgets:
| Plan | Price | Key Features | Best For |
|---|---|---|---|
| Basic | Free | Real-time scores, basic news updates | Fans who want up-to-date information |
| Pro | $9.99/month | Player stats, team rankings, advanced analytics | Serious fans and amateur analysts |
| Enterprise | Custom Pricing | All features, API access, custom reports | Professional teams and organizations |
The Basic plan is free and ideal for fans looking to stay updated on scores and news. The Pro plan, priced at $9.99 per month, offers advanced analytics and deeper insights, making it perfect for dedicated fans and hobbyist analysts. For professional teams and organizations, the Enterprise plan provides a fully customizable experience, including API access and tailored reporting.
Benefits for Users
StatPro makes baseball analytics accessible to everyone, whether you're a casual fan, an amateur analyst, or part of a professional organization:
- Casual fans can quickly get clear, digestible insights into games without needing to sift through complex data.
- Amateur analysts benefit from having professional-grade tools at their fingertips, making it easier to track trends and evaluate players without jumping between multiple platforms.
- Professional organizations gain access to in-depth data and custom reporting, enabling sharper player evaluations and more strategic decision-making.
With its combination of real-time stats, advanced tools, and flexible pricing, StatPro ensures that users at every level can engage with baseball analytics in a meaningful way.
Conclusion
Advanced metrics have completely changed the way we evaluate player performance. Stats like WAR, wOBA, and FIP go far beyond traditional numbers, offering a clearer picture by separating skill from luck and distinguishing short-term trends from long-term consistency.
The shift from basic stats like batting average and RBIs to more comprehensive analytical tools highlights baseball's ongoing pursuit of precision in measuring success. As discussed earlier, these metrics now play a central role in critical decisions - whether it’s signing players, negotiating contracts, making in-game tactical moves, or developing talent.
What’s truly exciting is how accessible these tools have become. Once reserved for insiders and experts, advanced metrics are now available to anyone willing to dive in. Whether you're a fan wanting to understand the game on a deeper level, an aspiring analyst creating your own projections, or a scout evaluating talent, these stats open up a world of insights.
This growing accessibility is where platforms like StatPro come in. StatPro bridges the gap between complex analytics and practical use, making it easier for everyone - from casual fans to professional scouts - to tap into the same data driving MLB decisions. With features like real-time MLB stats, customizable reports, advanced analytics, and API access, StatPro ensures that anyone who loves the game can explore it with the same tools as the pros.
While new metrics will undoubtedly emerge, the mission remains the same: using data to make smarter decisions and improve performance. With the right tools and a deeper understanding, advanced baseball stats turn raw numbers into meaningful insights, enriching how we analyze and enjoy the game that holds a special place in America’s heart.
FAQs
How do advanced baseball metrics like WAR and wRC+ influence player contracts and trades?
Advanced baseball stats like WAR (Wins Above Replacement) and wRC+ (Weighted Runs Created Plus) have completely changed how teams evaluate players for contracts and trades. These metrics dig deeper than traditional stats like batting average or RBI, offering a clearer picture of a player's overall value and offensive impact.
Take WAR, for instance. It measures a player's total contribution by comparing their performance to that of a replacement-level player. This helps teams decide if a player's production matches their salary or trade worth. On the other hand, wRC+ adjusts a player's offensive numbers by factoring in things like ballpark conditions and league averages, making it easier to compare players across different settings.
With these advanced metrics, teams can make more informed decisions, ensuring their investments go toward players who deliver the most on the field.
What are some drawbacks of using metrics like FIP and wOBA to evaluate player performance?
While FIP (Fielding Independent Pitching) and wOBA (Weighted On-Base Average) are excellent for analyzing players, they aren't without their shortcomings. For instance, wOBA doesn’t factor in a player’s defensive skills or their position on the field. This can lead to undervaluing players who excel defensively or are capable of playing multiple positions. It also tends to underemphasize the role speed plays in a player’s overall impact.
On the other hand, FIP zeroes in on what a pitcher can directly control - like strikeouts, walks, and home runs - while leaving out key elements such as defensive support and park conditions. As a result, FIP might not always paint the full picture of a pitcher’s performance within the broader game context.
To truly understand a player’s value and contributions, it’s best to use these metrics in combination with other statistics, offering a more well-rounded perspective.
How does StatPro help fans and analysts understand advanced baseball metrics?
StatPro takes the mystery out of advanced baseball metrics by breaking down stats like WAR (Wins Above Replacement), wOBA (Weighted On-Base Average), and FIP (Fielding Independent Pitching) into straightforward, easy-to-grasp explanations. Whether you're just getting into the game or you're a seasoned analyst, StatPro offers practical insights paired with real-world examples to show how these numbers help evaluate players, refine team strategies, and support data-driven decisions.
With intuitive tools and resources, StatPro makes it simple for anyone to dive into these advanced stats, turning modern baseball analysis into something both accessible and exciting.