How to Analyze NBA Play-by-Play Data
Collect, clean, and analyze NBA play-by-play data with Python/R and pbpstats; compute possessions, ORtg, lineup impact, clutch and strategy insights.

Analyzing NBA play-by-play data transforms how we understand basketball. Unlike box scores, this data captures every event in a game - shots, fouls, rebounds, substitutions, and more - along with timestamps and player details. Here's what you need to know:
- What It Is: A detailed log of every game event, including shot locations, possession times, and lineup combinations.
- Why It Matters: It helps evaluate player efficiency, team strategies, and game flow beyond traditional stats.
- Where to Find It: Platforms like Basketball-Reference, NBAstuffer, and the NBA Stats API offer access to this data.
- How to Use It: Clean and structure the data, calculate advanced metrics like Offensive Rating (ORtg), and analyze lineups, possessions, and clutch performance.
Start by organizing the data and using tools like Python or R to clean errors and generate insights. Dive deeper into metrics like adjusted plus-minus, shot efficiency, and lineup effectiveness to uncover patterns that shape wins.
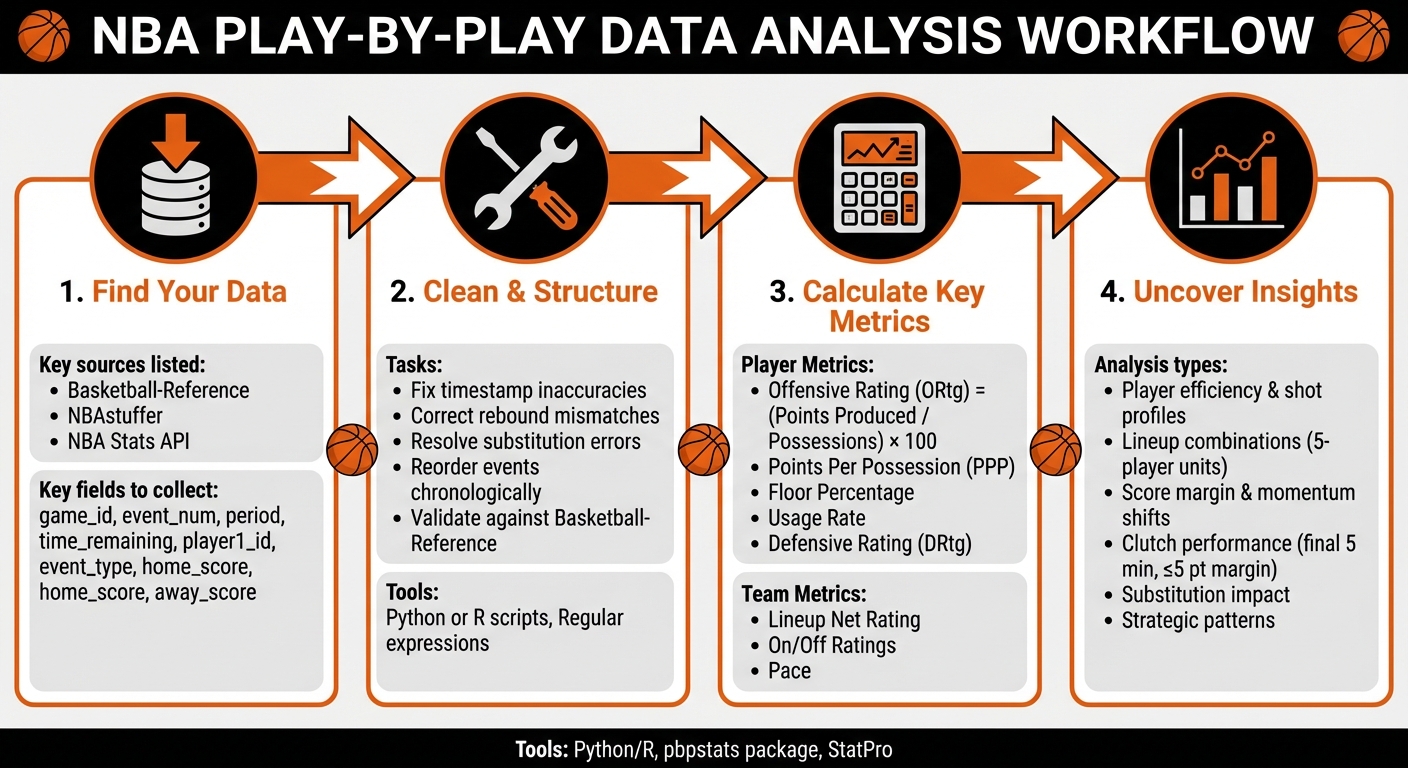
NBA Play-by-Play Data Analysis Workflow: From Data Collection to Insights
Preparing and Structuring Play-by-Play Data
Key Fields in Play-by-Play Data
When working with NBA play-by-play data, only a handful of fields are truly essential. The game_id (e.g., "0022201086") serves as a unique identifier for each matchup, grouping all events from a single game. The event_num field sequences these plays, ensuring the game timeline can be reconstructed accurately.
To break the game into phases, use period (e.g., 1 for the first quarter, 5 for overtime) alongside time_remaining (e.g., "10:30"). Player-specific identifiers like player1_id (e.g., "201939" for Stephen Curry) and player1_team_id (e.g., "1610612744" for the Golden State Warriors) link actions to the right players and teams.
The event_type and event_action_type fields describe the nature of each play, such as "Shot" or "3pt Shot Made." To track score margins and analyze player impact, use fields like home_score, away_score, and lineup details (away_player1 through away_player5, and home_player1 through home_player5).
Data Cleaning and Standardization
Even official NBA play-by-play data isn’t flawless - it often requires meticulous cleaning. For example, in December 2020, data scientist rainmantrail manually corrected hundreds of errors spanning five recent NBA seasons. While his code addressed many issues, manual fixes were still necessary for problems like timestamp inaccuracies, rebound mismatches, and substitution errors.
To tackle these inconsistencies, write scripts (in Python or R) to reorder events chronologically, ensure shots occur before rebounds, and fix substitution sequences. Regular expressions can help extract information like shot locations and player actions from play descriptions. After cleaning, validate your data by comparing aggregated stats - such as minutes played, points, and rebounds - with reliable sources like Basketball-Reference.
Building Derived Datasets
Once your data is cleaned, you can create specialized datasets to enable deeper analysis. Tools like the pbpstats Python package can automatically generate additional insights, such as on-court lineups and possession details (e.g., start time, end time, score margin, and previous possession outcomes).
For custom reports, use Pandas to manipulate columns, group events, and summarize data. For example, to build a possession table, track possession changes - these typically occur after made shots, defensive rebounds, turnovers, or specific fouls. These derived datasets are vital for calculating advanced metrics like adjusted plus-minus and lineup efficiency ratings.
With properly cleaned and structured data, you’ll be ready to dive into advanced metrics and uncover deeper insights into player and team performance.
Analyzing Player Performance Metrics
Calculating Possessions and Key Metrics
Possessions are the foundation for understanding player performance. A possession ends when a player attempts a field goal, misses a shot without grabbing the offensive rebound, turns the ball over, or enters a free-throw sequence where the final shot determines possession outcomes. To analyze possessions effectively, track events such as turnovers, shot attempts, missed shots, and rebounds.
Once possessions are identified, you can calculate key metrics. For instance, offensive rating (ORtg) is calculated by dividing a player's individual points produced by their total possessions, then multiplying the result by 100. Dean Oliver explains:
Individual offensive rating is the number of points produced by a player per hundred total individual possessions. In other words, 'How many points is a player likely to generate when he tries?'
Another metric, points per possession (PPP), is determined by dividing a player's total points by their possession count and multiplying by 100. Additional metrics, like floor percentage - the ratio of scoring possessions to total possessions - and usage rate, provide deeper insights. Usage rate can be estimated by summing a player's field goal attempts, free throw attempts (weighted by 0.44), and turnovers.
These metrics are essential for evaluating both scoring efficiency and defensive contributions.
Evaluating Scoring Efficiency and Shot Profiles
Possession data also helps assess scoring efficiency by analyzing shot profiles. Start by filtering play-by-play data to isolate a player's field goal attempts. Categorize each shot by type (e.g., layup, dunk, pull-up jumper, step-back jumper, three-point shot) and by shot zone (e.g., 2-foot, 6-foot, 15-foot, 23-foot, 26-foot, 27-foot). Calculate field goal percentages and points per attempt for each category to pinpoint shooting strengths and areas for improvement.
Tools like pbpstats can create detailed shot charts, which visually map out a player's shot zones and efficiency. These charts are invaluable for comparing metrics such as three-point percentage from the corner versus above the break or mid-range accuracy compared to attempts at the rim. They provide a clear picture of where a player excels and where adjustments might be needed.
Measuring Defensive Impact and Foul Drawing
Cleaned play-by-play data also enables detailed tracking of defensive metrics. Defensive contributions can be evaluated by monitoring events like steals (STL), blocks (BLK), defensive rebounds (DRB), and personal fouls (PF). For example, in the 2024–25 NBA season, Mikal Bridges (NYK) recorded 52 fouls drawn and 24 blocks, while DeMar DeRozan (CHI) tallied 277 fouls drawn and 75 blocks during the 2023–24 season. Basketball-Reference's play-by-play data includes columns for "Fouls Committed", "Fouls Drawn", "Blkd" (blocked shots), and "And1" events, offering a comprehensive view of defensive actions.
For a deeper dive, apply Dean Oliver's Defensive Rating (DRtg), which estimates how many points a player allows per 100 possessions they directly face while on the court. This metric relies on tracking defensive stops - instances where a player ends an opponent's possession through blocks, steals, defensive rebounds, or forcing turnovers and missed shots. Additionally, foul-drawing ability can be assessed using the %Fouled metric, which calculates the percentage of a player's touches that result in drawing a foul.
These tools and metrics provide a robust framework for analyzing both offensive and defensive performance.
Examining Team Strategies and Lineups
Analyzing Lineups and On/Off Metrics
Play-by-play data offers a detailed snapshot of every player on the court during each event, making it possible to identify unique 5-player lineups and assess their performance. By grouping possessions by lineup, you can calculate key metrics like Offensive Rating, Defensive Rating, Net Rating, and Pace to evaluate effectiveness.
Take the 2024–25 NBA season as an example: the Minnesota Timberwolves' lineup of R. Gobert, J. Randle, D. DiVincenzo, A. Edwards, and J. McDaniels achieved an Offensive Rating of 123.8, a Defensive Rating of 111.1, and a Net Rating of 12.7. Individual player impact is further illuminated through On/Off metrics. For instance, Nikola Jokić of the Denver Nuggets posted an OnCourt ± per 100 possessions of 10.5 and an On-Off of 19.0, while Shai Gilgeous-Alexander of the Oklahoma City Thunder recorded 16.9 and 11.1, respectively. These numbers underscore how player combinations can significantly influence team performance.
Identifying Strategy Patterns
Beyond lineup metrics, play-by-play data reveals patterns in team strategies. By analyzing event sequences, you can uncover offensive and defensive tendencies that shape a game. Filtering data fields like event_type and event_action_type allows you to count specific plays - such as dunks, three-pointers, blocks, and steals - highlighting a team's preferred actions. Shot selection analysis adds another layer, showing how teams approach scoring opportunities. Additionally, tracking turnover types, such as "BadPass" or "LostBall", alongside fouls committed and drawn, provides valuable insights into a team’s ball security and foul management.
To dig deeper, contextual filters like score_margin, period, time_remaining, and shot_clock_range help identify strategic shifts. For example, a team might increase three-point attempts when trailing late in the game or adjust defensive intensity depending on possession outcomes. Tools like the pbpstats package can further simplify this process, offering detailed possession data - such as start/end times and score margins - making it easier to track how strategies evolve throughout a game. Substitution patterns also offer a window into strategic adjustments.
Substitution Impact Analysis
Substitutions play a pivotal role in shaping team rotations and efficiency. By tracking player entries and exits, you can compare performance metrics before and after substitutions. Metrics like Offensive Rating, Defensive Rating, and Net Rating often shift with rotation changes, providing insights into how coaching decisions impact a team’s success. For instance, during the 2024–25 season, Christian Braun of the Denver Nuggets posted an OnCourt ± per 100 possessions of 8.9 and an On-Off of 15.0, highlighting how his presence improved team efficiency. Analyzing these shifts helps identify which rotations work best and which adjustments might need refinement.
To streamline the process, tools like StatPro (https://statpro.io) enhance the visualization and interpretation of these advanced metrics, turning raw data into actionable insights with ease.
Visualizing Game Flow and Situational Performance
Mapping Score Margins and Momentum Shifts
To understand how a game evolves, you can track the score margin, team scores, period, and time remaining. Plotting the score margin over time creates a time series visualization that highlights key moments - like scoring runs, collapses, and dramatic comebacks.
For example, in April 2025, an NBA project analyzed 25 years of game data using probit regression. The result? Interactive charts showing comeback probabilities that follow a square root trend, with a noticeable home-court advantage. Interestingly, modern NBA games (from 2014 onward) show slightly higher comeback rates compared to earlier periods. The data also reveals that top-ranked teams trailing against lower-ranked opponents are more likely to stage a comeback. These trends provide a foundation for evaluating how teams and players handle high-pressure, clutch situations.
Evaluating Clutch Performance
After mapping score margins, zoom in on the final five minutes of games where the score margin is 5 points or less - this is where clutch moments unfold. By filtering data based on score margin and time remaining, you can pinpoint high-pressure situations. From there, calculate key performance metrics like Offensive Rating, Defensive Rating, and Net Rating for both individual players and specific lineups.
Visualization tools make it easier to dive into clutch performance data and share insights. Beyond just clutch moments, you can further segment the game to understand how different contexts influence performance.
Analyzing Performance by Game Context
Breaking performance down by period, home versus away games, and specific lineup matchups uncovers strategic details that standard box scores often miss. For instance, analyzing how certain lineups fare against specific opponents can reveal strategies that might otherwise go unnoticed.
Tools like StatPro (https://statpro.io) simplify contextual analysis by providing real-time stats and detailed insights. Whether you're comparing early-game and late-game efficiency or examining performance in back-to-back games, contextual filters help uncover deeper strategic patterns that traditional stats can't fully explain.
Conclusion and Next Steps
Summary of Key Concepts
NBA play-by-play data opens a window into the game that goes far beyond what traditional box scores can show. By dissecting individual game events, you can uncover patterns and insights that standard stats often miss. The techniques we've discussed here allow you to assess player efficiency, spot strategic trends, and track game momentum with a data-driven approach.
With this data, you can calculate advanced metrics such as Offensive Rating, Defensive Rating, and On-Off ratings to measure a player's true impact. Diving into five-man lineup performance, analyzing clutch moments, and monitoring score margins over time provides a clearer picture of the strategies that lead to wins. These tools offer a strong starting point for in-depth basketball analysis.
Getting Started with Play-by-Play Analysis
Now’s the time to put these concepts into action. If you’re looking for an easier way to dive in, platforms like StatPro (https://statpro.io) are a great resource. They offer real-time stats and advanced analytics without the hassle of manual data scraping or programming. Their Pro plan, priced at $9.99/month, delivers tools like player stats, team rankings, and advanced metrics - letting you skip the grunt work and focus on drawing meaningful insights.
Start by exploring questions like: Which lineups dominate on the court? How do players influence scoring when they’re on versus off? Which areas of the court yield the highest shooting efficiency? As you get more comfortable, you’ll be ready to tackle more complex analyses, such as understanding substitution patterns, identifying opponent tendencies, and evaluating situational performance - key insights for shaping real basketball strategy.
NBA Breakdown & Analysis (DEC 13) | Full Slate & Charts Explained
FAQs
What are the best tools for cleaning NBA play-by-play data?
To prepare NBA play-by-play data for analysis, several tools can help you organize and clean your dataset efficiently:
- pbpstats (Python): This Python library lets you download raw play-by-play data in JSON or CSV formats. It also includes features to correct event sequences and fill in missing lineup details, making your data more reliable.
- Pandas (Python): Once your data is loaded, Pandas is ideal for cleaning tasks like managing missing values, renaming columns, and reshaping the dataset to fit your analysis needs.
-
nbastatR (R): With the
play_by_play()function, you can directly import play-by-play data into R. From there, tools likedplyrandjanitormake it easier to clean, organize, and standardize your dataset.
These tools simplify the process of transforming raw data into a well-structured format, ready for analyzing player stats or team strategies.
How can I analyze NBA play-by-play data to measure player efficiency?
To analyze player efficiency using NBA play-by-play data, the first step is to collect raw data from official NBA sources or platforms that compile play-by-play events. Once you have the data, load it into a statistical tool like R, which offers packages to identify and tag key player actions such as shots, assists, rebounds, and turnovers.
From there, calculate efficiency metrics by adjusting key stats - like field goals, assists, and turnovers - on a per-minute basis. These adjusted stats can then be combined into a single rating using weighted formulas designed to capture a player’s overall impact, factoring in both offensive and defensive contributions. To ensure accuracy, compare your results against league averages and use visualizations to identify trends over time or within specific lineups. For more advanced analysis, tools like StatPro can turn this data into interactive dashboards and detailed reports.
What are the most important metrics for analyzing team strategies with play-by-play data?
Play-by-play data offers a treasure trove of information for understanding team strategies by dissecting every moment of a game. Here are some key areas to focus on:
- Event details: Actions such as shots, turnovers, fouls, rebounds, and assists paint a clear picture of what unfolded during each play.
- Game context: Factors like timing, possession changes, and the game clock provide insight into pace, clutch-time performance, and transitions between defense and offense.
- Score trends: Monitoring score margins and lead changes helps identify momentum swings and the significance of specific plays.
- Lineup data: Knowing which players were on the court at any given time sheds light on lineup efficiency and team chemistry.
- Shot zones: Data on where shots and rebounds happen reveals whether a team prioritizes the paint, mid-range, or long-range attempts.
When you piece these metrics together, patterns emerge - things like tempo, spacing, and how teams adapt to different situations. Tools like StatPro make it easier to turn this raw data into actionable insights, offering a deeper understanding of team performance and strategy.