
Game-Winning Scenarios: Predictive Models Explained
How sports predictive models combine historical, real-time, and contextual data to calculate win probabilities and inform coaching, betting, and fantasy decisions.

Predictive models in sports are reshaping how teams, coaches, and fans make decisions. These models use historical data, real-time stats, and advanced algorithms like Neural Networks to estimate outcomes such as win probabilities, player performance, and game strategies. For example:
- Neural Networks outperform older methods like Pythagorean formulas, achieving a Mean Absolute Error (MAE) of 0.052 in NFL predictions - equivalent to being off by just one game in a 17-game season.
- Real-time updates adjust predictions dynamically based on factors like score, time remaining, and injuries.
- Key metrics include scoring efficiency, turnovers, and Expected Points (EP), which evaluates plays based on down, distance, and field position.
Applications extend beyond the field. Coaches use these models for decisions like fourth-down plays, while bettors and fantasy players rely on them for value bets and roster optimization. With tools like StatPro ($9.99/month), users access live stats, player rankings, and win probabilities across major sports leagues like the NFL, NBA, and MLB.
Emerging technologies, such as Graph Neural Networks and edge computing, are pushing the boundaries further by delivering faster and more precise predictions. These advancements are changing how teams analyze performance and strategize in real-time.
What Is Predictive Modeling In Sports Technology Development? - Sports Jobs
Data Inputs for Game-Winning Predictions
Predictive models hinge on three main types of data: player and team metrics, historical and real-time game information, and environmental context. Together, these layers provide highly accurate win probabilities. Let’s break down each of these data categories and how they contribute to predictions.
Player and Team Performance Metrics
Metrics related to scoring are some of the most influential predictors. For example, in NFL models, points scored account for 54% of the predictive weight, while points allowed contributes 34%. These two factors alone explain the majority of a team's success rate. A well-trained neural network using these metrics can account for 89.1% of the variance in team performance.
But it’s not just about final scores. Efficiency metrics - like passing yards, rushing yards, and yards per play - offer deeper insights into how teams generate points. For in-game predictions, models track real-time stats such as down, distance-to-go, field position, and timeouts remaining. Even seemingly small factors like turnovers and penalties hold weight, each contributing 2% to predictive accuracy.
Advanced systems also use Expected Points (EP) to evaluate game situations. EP assigns a scoring value to specific plays based on down, distance, and field position. In basketball, metrics like pace-of-play and offensive rebounding rates capture a team’s ability to create scoring opportunities.
Historical and Real-Time Game Data
Historical data provides a baseline for predictions. Metrics like Elo scores are calculated using past win-loss records and head-to-head matchups, offering a snapshot of team strength.
On the other hand, real-time data captures the constantly changing dynamics of live games. For instance, during a Week 2 NFL game in September 2019 between Chicago and Denver, five plays in the final two minutes each shifted win probabilities by at least 25%. Inputs like current score, down, distance, and field position allow models to update predictions after every play.
"Shocking outcomes are like a wake-up call for Elo: They indicate that its pregame expectations were probably quite wrong and thus in need of serious updating." - FiveThirtyEight
Player injuries are another critical piece of real-time data. Models incorporate rolling performance ratings to adjust for the immediate impact of injuries. For example, the absence of a starting quarterback can drastically alter a team’s predicted performance.
Wearable technology is also changing the game. Biometric data - like heart rate, fatigue levels, and movement patterns - feeds into live models, helping predict performance dips or injury risks. This adds a layer of insight that historical stats alone can’t provide.
Environmental and Contextual Factors
Venue characteristics play a role even before the game begins. For instance, FiveThirtyEight’s NFL Elo model applies a home-field advantage of 48 points, though this dropped to 33 points during the 2020 season when games were played without fans. Travel distance also matters - teams lose 4 Elo points for every 1,000 miles traveled. Additionally, teams coming off a bye week gain a 25-point boost due to extra rest and preparation time.
Weather is another key factor. Wind, rain, and visibility can influence strategies, often favoring rushing plays over passing. In Formula 1, teams use real-time weather data to adjust strategies, such as predicting tire wear and planning pit stops.
Player health adds another layer of complexity. When a key player, like a starting quarterback, is injured, models must immediately adjust team strength. Machine learning now enables systems to anticipate injury risks based on workload and biomechanical data, rather than reacting only after injuries occur.
| Contextual Factor | Quantification Method | Impact on Prediction |
|---|---|---|
| Home-Field Advantage | +48 Elo Points (NFL) | Increases home win probability |
| Travel Fatigue | +4 Elo Points per 1,000 miles | Penalizes teams traveling long distances |
| Rest/Bye Week | +25 Elo Points | Improves team readiness |
| Player Injury (QB) | VALUE metric × 3.3 | Significantly reduces team strength |
"Factors such as player fatigue, opponent behavior, weather, and even crowd influence make prediction incredibly complex." - Folio3
These contextual details add depth to predictive models, turning static data into dynamic, real-time forecasts that reflect the unpredictable nature of live sports.
Predictive Models and Algorithms
Once you've gathered your data, the next step is selecting a predictive model. Each model has its strengths - some prioritize simplicity and interpretability, while others focus on achieving the highest predictive accuracy. Here’s a closer look at some of the most common models in sports analytics.
Logistic Regression for Win-Loss Predictions
Logistic regression is a cornerstone in sports analytics, particularly for predicting binary outcomes like wins or losses. Its use of a sigmoid function ensures predictions fall between 0 and 1, making it perfect for answering questions like, "What’s the probability this team wins?" rather than, "How many points will they score?".
One of the key advantages of logistic regression is its interpretability. The model's coefficients clearly show how variables - such as turnovers, field position, or remaining timeouts - impact win probability. For instance, in February 2021, analyst Ben Dominguez used Python’s scikit-learn library to build an NFL win probability model. Trained on data spanning 1999 to 2019 and tested on the 2020 season, the model achieved a 63.5% accuracy rate using eight features based on exponentially weighted rolling Expected Points Added (EPA). In one test during Week 8 of the 2020 season, it predicted the Kansas City Chiefs' win over the New York Jets with 87.4% confidence.
"Logistic regression has become a cornerstone in modern sports analytics by providing a robust framework for predicting binary outcomes such as wins versus losses."
– Sarah Lee, AI Analyst
Logistic regression also shines in real-time applications. In January 2021, Geoffrey Grosenbach developed an in-game NFL win probability model using R’s glm() function. By analyzing 473,356 plays from the 2009–2020 seasons and incorporating nine real-time attributes, the model demonstrated how win probability evolves during a game, especially as a team approaches the goal line. To handle large datasets and avoid overfitting, techniques like Lasso (L1) or Ridge (L2) regularization are often applied. Additionally, interaction terms - such as the combined effect of a player’s speed and stamina - can capture more nuanced game dynamics.
For scenarios requiring more complex analyses, advanced neural models offer a deeper dive into interactions beyond binary outcomes.
1D CNN and Transformer Hybrid Models
For capturing non-linear interactions and extracting intricate patterns, hybrid models combining 1D Convolutional Neural Networks (CNNs) and Transformers are gaining traction. These models use multi-layer architectures and activation functions like ReLU to process large datasets effectively. For example, a feedforward neural network achieved an R² of 0.891 in predicting NFL winning percentages, with a Mean Absolute Error (MAE) of 0.052 - equivalent to about a one-game margin in a 17-game season.
"The integration of advanced machine learning models provides a powerful tool for enhancing decision-making processes across the NFL landscape."
– Frontiers in Sports and Active Living
These models are especially valuable for analyzing sequential data, such as game possessions or video frames, at high speeds - up to 30 frames per second. This capability prevents inflated metrics caused by rapid events, like multiple rebounds during a single possession. Advanced XGBoost models, for instance, have improved shot occurrence (xS) predictions by 9.5% in log loss compared to logistic regression baselines. New spatio-temporal frameworks can even estimate event probabilities before they happen. In soccer, the "xG+" framework combines shot probability with goal probability, achieving lower error metrics in scoring forecasts (MSE of 2.84 versus 2.94 for traditional xG).
Expected Goals (xG) and Poisson Distributions
Expected Goals (xG) is a widely used metric that assigns a probability (between 0 and 1) to each shot, representing its historical likelihood of resulting in a goal. For example, penalty kicks typically receive xG values between 0.76 and 0.79, reflecting their high conversion rates.
"Expected goals (xG) is a metric designed to measure the probability of a shot resulting in a goal."
– StatsBomb
Once xG values are calculated, Poisson distributions are often used to model the number of goals a team might score. The process begins with estimating each team’s expected score, then generating independent Poisson distributions for both teams. These distributions are combined into a matrix of possible outcomes, which helps estimate the probabilities of a win, loss, or draw. This approach is particularly effective in low-scoring sports like soccer, where outcomes are heavily influenced by variance, though it’s also applied in ice hockey and has been explored for basketball.
A notable example is FiveThirtyEight’s soccer model, which adjusts draw probabilities in its Poisson matrix by about 9% to better reflect the frequency of ties in professional leagues. Research shows that between 79% and 93% of soccer team seasons align closely with xG predictions within a 95% confidence interval. Compared to traditional metrics like total shots or possession, xG-based models provide a more accurate forecast of team performance and future success.
Model Comparison Table
Predictive Model Comparison: Accuracy, Strengths, and Sports Applications
Choosing the right model depends on what you're aiming to achieve and the computational resources at your disposal. Each model has its own strengths and weaknesses, balancing accuracy, interpretability, and real-time performance. Understanding these trade-offs is crucial for aligning the model to your specific sports analytics goals.
Comparison Table
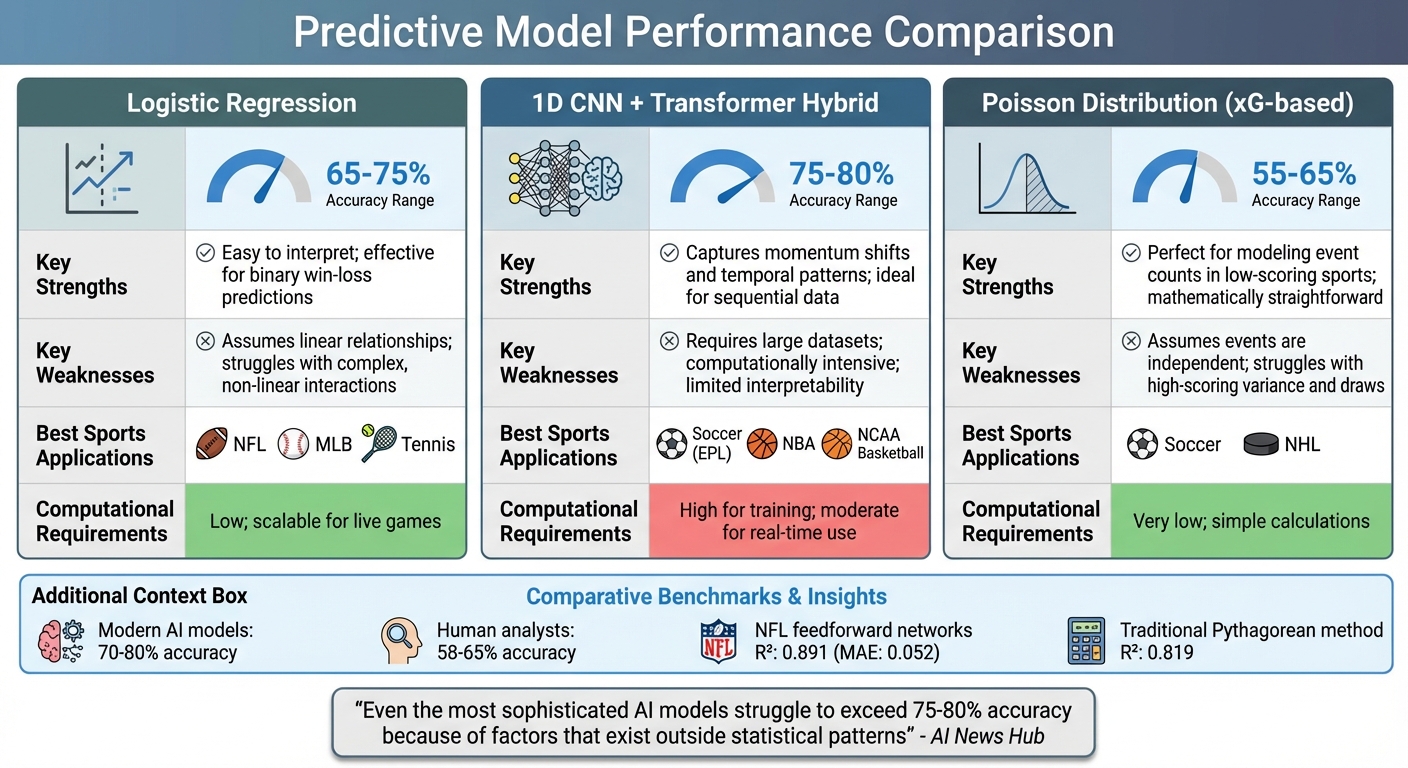
The table below highlights common predictive models. For example, hybrid models like a 1D CNN combined with Transformers often deliver higher prediction accuracy for NFL games, while logistic regression remains a reliable option for quick and interpretable win-loss forecasts. Meanwhile, Poisson-based models are better suited for low-scoring sports such as soccer and hockey, though their accuracy can be affected by the randomness inherent in such games.
| Model Type | Accuracy Range | Key Strengths | Key Weaknesses | Best Sports Applications | Computational Requirements |
|---|---|---|---|---|---|
| Logistic Regression | 65-75% | Easy to interpret; effective for binary win-loss predictions | Assumes linear relationships; struggles with complex, non-linear interactions | NFL, MLB, Tennis | Low; scalable for live games |
| 1D CNN + Transformer Hybrid | 75-80% | Captures momentum shifts and temporal patterns; ideal for sequential data | Requires large datasets; computationally intensive; limited interpretability | Soccer (EPL), NBA, NCAA Basketball | High for training; moderate for real-time use |
| Poisson Distribution (xG-based) | 55-65% | Perfect for modeling event counts in low-scoring sports; mathematically straightforward | Assumes events are independent; struggles with high-scoring variance and draws | Soccer, NHL | Very low; simple calculations |
These insights highlight the trade-offs teams face when selecting models for specific sports. Modern predictive models now achieve accuracy rates between 70–80%, significantly outperforming human analysts, who typically reach 58–65% accuracy. As AI News Hub explains:
"The 'human element' in sports creates an accuracy ceiling. Even the most sophisticated AI models struggle to exceed 75–80% accuracy because of factors that exist outside statistical patterns."
This helps explain why predictions for high-scoring sports like the NBA tend to be more accurate (67–72%) compared to low-scoring games like soccer (55–65%), where randomness plays a larger role.
For the NFL, advanced models such as feedforward networks have demonstrated measurable improvements over traditional methods. For instance, the Pythagorean method achieves an R² of 0.819. Teams are increasingly shifting from simpler models like logistic regression to more complex approaches in critical situations.
The choice of model also reflects broader trends in sports analytics. During the 2024–2025 NBA season, the Boston Celtics used spatiotemporal data to fine-tune their defensive rotations, which contributed to their playoff success. Likewise, Manchester City and Liverpool FC have leveraged AI-powered video tracking to account for tactical adjustments.
Building and Training Predictive Models
Developing predictive models for game-winning scenarios involves a structured approach, starting with solid data collection, thorough preprocessing, and careful model training. Here's a breakdown of the key steps.
Data Collection and Preprocessing
Every predictive model begins with reliable data. Teams typically gather historical play-by-play data spanning 8–10 seasons from sources like the NFL API or sports reference platforms such as ESPN. However, raw data often includes irrelevant plays and inconsistencies that need to be cleaned. This involves removing noise, standardizing metrics (like converting time of possession into total seconds), and applying lag functions to prevent data leakage.
Feature engineering transforms this cleaned data into meaningful variables. Essential features include score differential, down and distance, timeouts remaining, and field position. External factors, such as weather conditions (wind speed, temperature), altitude, and travel-related fatigue, can further refine predictions. Advanced analysts often create composite metrics like "Expected Points" (EP), running win percentages, and "clutch factors" to capture complex game dynamics. Addressing class imbalances is also critical - methods like SMOTE have been shown to boost accuracy significantly, as one NFL model improved from 71% to 86.3% using this technique.
"A normal random variable can assume fractional values, but the final margin of victory in a game must be an integer."
This refined dataset becomes the foundation for effective model training.
Model Training and Testing
With the data ready, the focus shifts to selecting and training the right algorithm. Logistic regression is often used for binary win-loss predictions, while Random Forest and XGBoost are better suited for multi-class play classifications.
To maintain the temporal integrity of sports data, it's important to use time-based splits - training on earlier seasons and testing on later ones - to account for rule changes and evolving strategies. A common split is 70/30 for training and validation, though smaller datasets benefit from K-Fold cross-validation (typically 10 folds). For play-by-play models, grouped cross-validation by game_id ensures all plays from a single game remain together, reducing the risk of overfitting to specific game contexts. For example, during the 2020–2021 seasons, the Tampa Bay Lightning used scenario analysis systems to simulate 82,000 game situations weekly, aiding their consecutive Stanley Cup victories.
Optimization and Evaluation
After training, the next step is optimization. This includes tuning hyperparameters and enforcing logical consistency, such as monotone constraints to ensure that an increase in score differential always correlates with a higher win probability. Gradient-boosted models often use early stopping (50–200 rounds) to avoid overfitting.
Evaluation metrics are equally important. For probability-based predictions, Logloss is preferred over simple accuracy because it penalizes overconfident but incorrect predictions. Calibration plots help verify that, for example, a 70% win prediction corresponds to a 70% actual win rate. For categorical outcomes like play types, metrics like Precision, Recall, and F1 scores provide a more detailed view of model performance than accuracy alone.
The Golden State Warriors demonstrated the value of predictive modeling by implementing AI-driven load management tools, which reduced player injuries by 37% during their championship years.
"If your data visualization is hard to understand, you've lost the game. Coaches want actionable insights fast."
Finally, stress-testing the model by simulating scenarios like key player absences ensures it captures true performance shifts. These steps ensure the model is robust and reliable, supporting accurate real-time game predictions while complementing earlier insights into model performance.
Applications in NFL, NBA, and MLB
Using predictive models in sports has transformed how teams strategize for success. While the NFL, NBA, and MLB each adapt analytics to their unique game structures, the overarching goal stays the same: figuring out what drives victories and defeats.
NFL: Play Outcomes and Game Results
In football, analytics dive deep into both individual plays and overall game results. For example, Random Forest classifiers can predict play types - pass, run, punt, or field goal - with an accuracy of 71.0%. This jumps to 86.3% when SMOTE (Synthetic Minority Oversampling Technique) is applied. Key factors in these predictions include the yard line, quarter, time left, current down, yards-to-go, score differential, and remaining timeouts.
Win Probability (WP) models take it a step further, tracking momentum shifts during games. A dramatic example comes from a September 2019 game between the Chicago Bears and Denver Broncos. In the final two minutes, five critical plays - including a fourth-down conversion and a game-winning field goal - each caused win probability to swing by at least 25%. These models have even influenced league decisions; during the 2019 offseason, the NFL Competition Committee used WP data to assess which penalties had the biggest impact on game outcomes.
Player injuries also factor heavily into predictive models. When Aaron Rodgers was injured in Week 6 of the 2017 season, FiveThirtyEight's Elo model dropped the Green Bay Packers' rating by 176 points. Rodgers had a rolling "VALUE" rating of 66, while his backup, Brett Hundley, had just 14. This downgrade slashed the Packers' win probability for their next game against the Saints from 63% to 39%. Models even incorporate weather variables - like temperature, wind speed, and visibility - to guide strategic decisions between running and passing plays.
While NFL analytics focus on the granular details of plays and momentum, the NBA leans heavily into individual performance and matchup analysis.
NBA: Player Matchups and Shot Predictions
Basketball analytics often rely on the Pythagorean expectation formula to predict season-long win percentages, based on points scored versus points allowed. For the NBA, the formula uses an exponent of 13.91 - much higher than the NFL's 2.37 - because basketball involves more scoring and continuous action.
Player matchup models zero in on individual metrics, such as shooting accuracy from specific court zones, defensive matchups, and fatigue based on minutes played. Coaches can even use real-time data to tweak lineups mid-game, optimizing player combinations based on projected performance.
While basketball thrives on fast-paced dynamics, baseball's slower, pitch-by-pitch nature offers a completely different approach to analytics.
MLB: Pitch Analysis and Win Probabilities
Baseball analytics break the game down pitch by pitch, making it perfect for sequential probability models. Win probabilities shift with every at-bat, and analysts use historical pitch data - like velocity, spin rate, and location - to predict outcomes such as strikeouts, walks, or hits.
The Pythagorean expectation also plays a role in baseball, using runs scored and runs allowed to project season records. These calculations consider factors like starting pitcher performance, bullpen depth, and even ballpark characteristics (e.g., altitude or field dimensions) that influence scoring environments.
Each sport brings its own challenges and opportunities for analytics, but the common thread is clear: data is reshaping how teams plan, play, and win.
StatPro's Game-Winning Analytics Tools
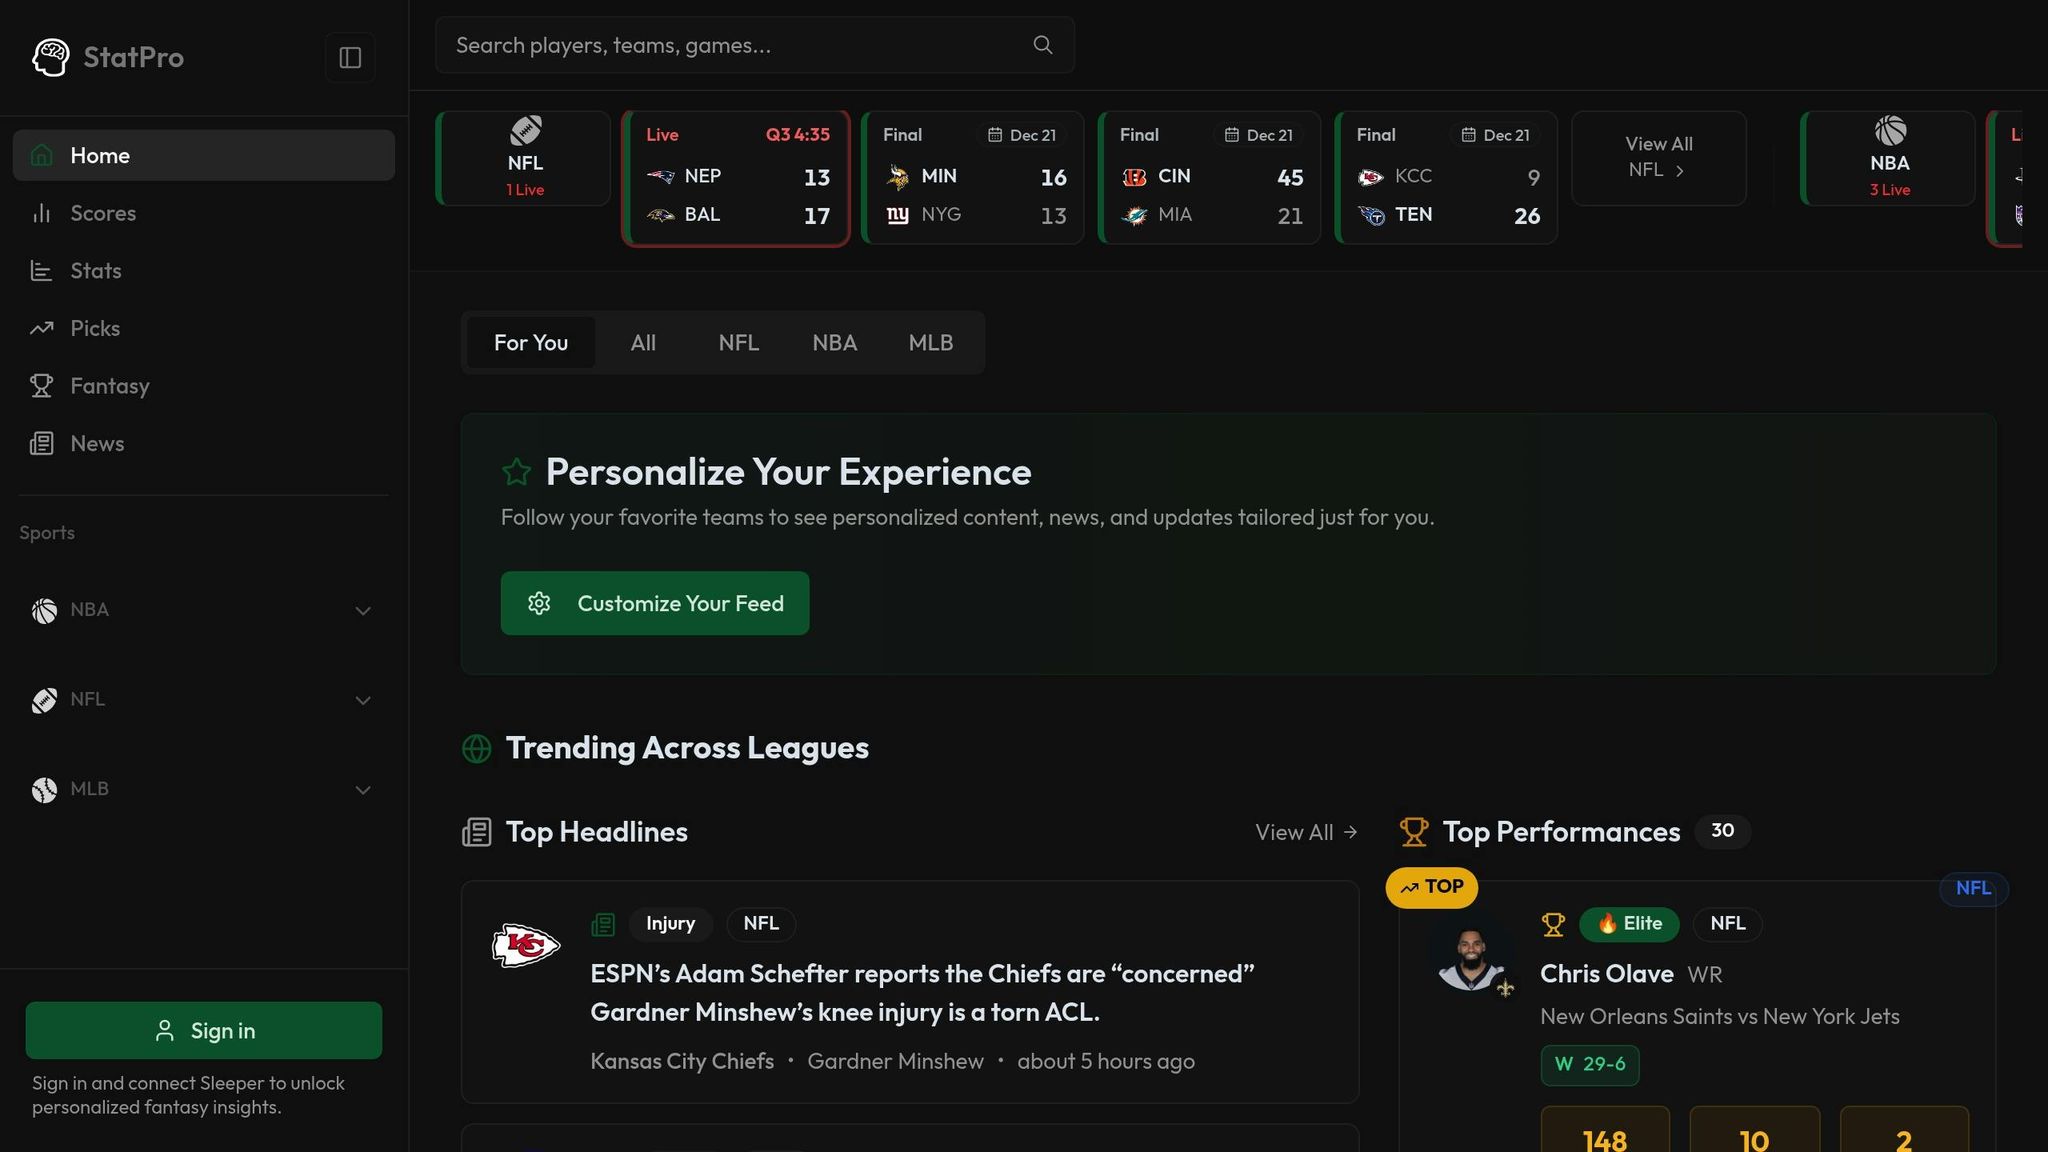
Building on the earlier discussion of predictive models, StatPro takes analytics to the next level by offering tools that deliver real-time insights right to your screen. Effective predictive modeling hinges on two key elements: powerful algorithms and access to live, high-quality data. StatPro brings it all together in one platform, consolidating NFL, NBA, and MLB analytics into a single hub. This setup provides the real-time data needed to anticipate game-changing scenarios.
The platform continuously tracks live scores, stats, and game insights across these three major leagues. Want to dig deeper? You can filter data by conference or division, allowing for a more focused analysis. This level of detail sharpens your understanding of team and player performance.
StatPro's "Game Insights and Analysis" feature is particularly noteworthy. It highlights key variables - like the current score, down and distance, and field position - in an easy-to-follow, play-by-play format. For example, in the NFL, being on the opponent's 1-yard line comes with an expected value of about 6.9 points. StatPro's interface brings these critical, high-stakes moments to your attention in real time, making it easier to spot opportunities as they unfold.
StatPro Pro Plan Features
For $9.99 per month, the Pro Plan unlocks a treasure trove of advanced analytics, including detailed player stats, team rankings, and top performance highlights. This plan is perfect for those who need actionable data to refine their forecasting models. It offers historical play-by-play data, which is ideal for building logistic regression and random forest classifiers. Meanwhile, real-time updates let you monitor metrics like Win Probability Added (WPA) during live games.
The Pro Plan also syncs with the Sleeper app, providing fantasy players with personalized performance projections. Sean Koerner, Director of Predictive Analytics at STATS, explains the value of expert insights:
"Just taking the projections at face value isn't as valuable as when you can have an expert break things down in order to see the different angles needed to figure which players are ideal for certain game types"
. StatPro bridges the gap between raw data and expert analysis, giving users both the numbers and the context they need to make smarter predictions. Whether you're an analyst or a passionate fan, these tools make it easier to apply predictive insights in real time.
Advanced Techniques and Future Trends
AI Techniques for Sports Analytics
Graph Neural Networks (GNNs) are reshaping how we analyze team dynamics. Instead of focusing on individual players, GNNs treat players as interconnected nodes in a network, with passes and movements forming the connections (or edges). This allows for a deeper understanding of how teammates interact on the field. For example, Google DeepMind collaborated with Liverpool FC to create "TacticAI", a graph-based system designed to assess corner kick strategies. Coaches preferred the AI-generated tactics an impressive 90% of the time compared to traditional methods.
Offline Reinforcement Learning (RL) is another game-changer, utilizing historical game data to develop strategies without requiring live simulations. Techniques like Conservative Q-Learning (CQL) enable these systems to analyze past performances and make predictions. During the 2021/22 Belgian Pro League season, a model combining Temporal Graph Networks with CQL was used to predict win probabilities in a match between Royal Antwerp and Club Brugge. The system outperformed traditional bookmaker odds, achieving an error rate of just 0.1. Moreover, AI systems employing offline RL demonstrated 87% accuracy in forecasting offensive and defensive actions in soccer.
Transformer-based architectures are revolutionizing the processing of vast amounts of tracking data. For instance, the NBA's Second Spectrum system handles 3D player coordinates at a staggering 50Hz, processing 25GB of optical tracking data per minute. This system predicts five-second player trajectories while recommending defensive adjustments using Nash equilibrium analysis. It achieves 92% accuracy in predicting passes, all while maintaining latency under 150ms. This low latency is critical for delivering actionable insights in real time.
These advanced AI techniques are pushing the boundaries of sports analytics, enabling the rapid, real-time decision-making that modern sports demand.
Real-Time Data and Edge Computing
To complement these AI advancements, edge computing is tackling the challenge of processing live data with minimal delay. By preprocessing raw data at the source - such as in stadiums - edge nodes apply compression algorithms that reduce bandwidth usage by 60-80% before transmitting data to the cloud. This approach ensures sub-200ms latency, enabling quick and reliable decision support during live events.
The impact of edge computing is tangible. For example, INT8 quantization on devices like the Jetson AGX cuts model processing time by 3.2×, while Spiking Neural Networks perform real-time biomechanical analysis on wearables with an energy consumption of just 23mW. Additionally, federated learning is emerging as a solution for teams to collaboratively improve predictive models without sharing sensitive player data, addressing both privacy concerns and competitive integrity.
These edge-to-cloud architectures are enabling advanced AI models to operate where they're needed most - right on the sidelines or even on the field. Together, these innovations are driving the future of sports analytics, ensuring faster, smarter, and more precise decision-making in the heat of the game.
Conclusion
The development of predictive models has changed the way we analyze and influence game outcomes. These models revolutionize sports analytics by combining historical data, real-time stats, and contextual insights into a single win probability metric. Their accuracy stems from blending Expected Points (EP) with time-sensitive adjustments, ensuring that a lead late in the game is far more impactful than the same margin at the start.
"The win probability model, when combined with the expected points model, can be used to further evaluate the game impact of any given action during a game." - Vanguard403
Teams and coaches rely on these models to measure the impact of plays, make informed decisions, and gain deeper insights during live games.
StatPro simplifies this intricate process by offering detailed sports analytics and real-time stats for the NFL, NBA, and MLB. Their Pro Plan, priced at $9.99 per month, provides access to advanced analytics, player stats, team rankings, and standout performances - arming users with the same data-driven insights that professionals depend on.
Emerging AI technologies, like Graph Neural Networks and edge computing, are pushing the boundaries further. These tools enable faster, more precise predictions, enhancing decision-making from pre-game planning to last-second plays. Platforms like StatPro harness these advancements, delivering real-time analytics to support strategic choices across major sports leagues. This progress not only sharpens current strategies but also paves the way for even more dynamic, real-time decision-making in the future of sports.
FAQs
How do predictive models update win probabilities during live games?
Predictive models constantly analyze real-time game data to update win probabilities as the action unfolds. They consider crucial factors such as the current score, time left on the clock, which team has possession, and other situational details like home-field advantage, penalties, and timeout availability. These elements are run through advanced statistical techniques - like simulations or probability models - to estimate each team's chances of winning at any given moment.
By leveraging high-frequency data, such as play-by-play updates, scoring opportunities, or down-and-distance metrics, these models can adjust probabilities multiple times per second. Tools like StatPro supply the real-time stats and player data that power these calculations, ensuring fans, coaches, and analysts have the most precise and current win probabilities throughout the game.
What’s the difference between logistic regression and neural networks in sports analytics?
Logistic regression is a straightforward and easy-to-understand model that’s often used to predict binary outcomes, like determining whether a team will win or lose. It works by analyzing how different factors - like shooting percentage or turnovers - impact the odds of a particular result. This makes it a great choice for quick analyses and smaller datasets where simplicity is key.
Neural networks, by contrast, are far more advanced and capable. They rely on layers of interconnected nodes to uncover patterns and interactions that simpler models might miss. For example, they can account for the combined effects of factors like player fatigue and defensive positioning. That said, neural networks demand larger datasets, more computing power, and are harder to interpret when it comes to understanding how predictions are made.
The choice between these two models depends on what you need. Logistic regression is ideal when you prioritize speed and clarity, while neural networks shine when working with complex data and uncovering intricate patterns. Tools like StatPro can help you utilize either approach, depending on your sports analytics objectives.
How does StatPro use AI to improve sports predictions?
StatPro uses cutting-edge AI to provide highly precise sports predictions. It processes an enormous amount of data - everything from player movements and play-by-play events to biometric statistics - to uncover patterns and connections that impact game results. By applying methods like supervised learning and deep learning, the platform calculates advanced metrics such as Expected Goals (xG) and Expected Threat (xT) in real time.
As games unfold, StatPro’s AI engine dynamically updates win probabilities and player performance stats, offering real-time insights across NFL, NBA, and MLB games. Its intuitive dashboards turn complex data into clear, actionable predictions, empowering fans, teams, and bettors to make smarter decisions with insights that go far beyond traditional statistics.