Top 7 Injury Analytics Dashboards for Teams
Compare seven top injury analytics dashboards for pro teams — real-time tracking, predictive risk scores, recovery monitoring, and wearable integrations.
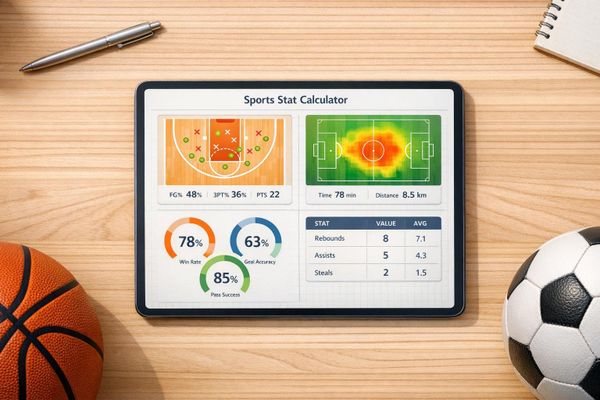
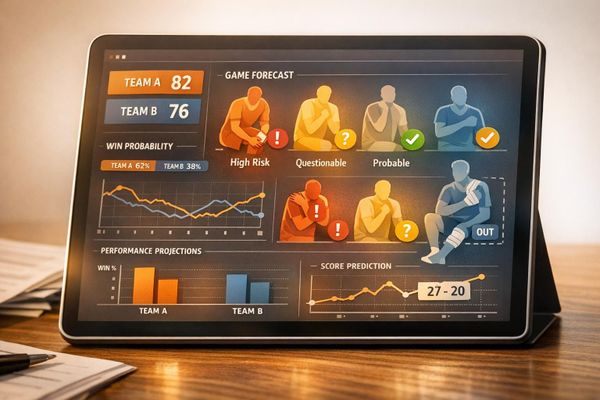
Professional sports teams rely heavily on injury analytics dashboards to keep players healthy and maximize performance. These tools centralize data like medical records, training loads, and wearable metrics to predict injury risks, guide recovery, and improve decision-making. Here's a quick look at the top seven platforms:
- StatPro: Combines real-time injury tracking with performance data for NFL, NBA, and MLB teams.
- ZoomCharts: Offers interactive Power BI visuals for deep injury trend analysis.
- SportsFirst InjuryTracker Pro: Focuses on secure record-keeping and workflow efficiency.
- SIC Score: Uses physician insights to evaluate player readiness and predict game outcomes.
- AthleteMonitoring: Tracks wellness, training loads, and injury risks in real time.
- Catapult Sports: Integrates wearable tech with software for detailed load and recovery insights.
- Teamworks AMS: Centralizes performance, health, and medical data from over 100 integrations.
These dashboards help teams prevent injuries, shorten recovery times, and make informed decisions about player availability. Below is a quick comparison of their features.
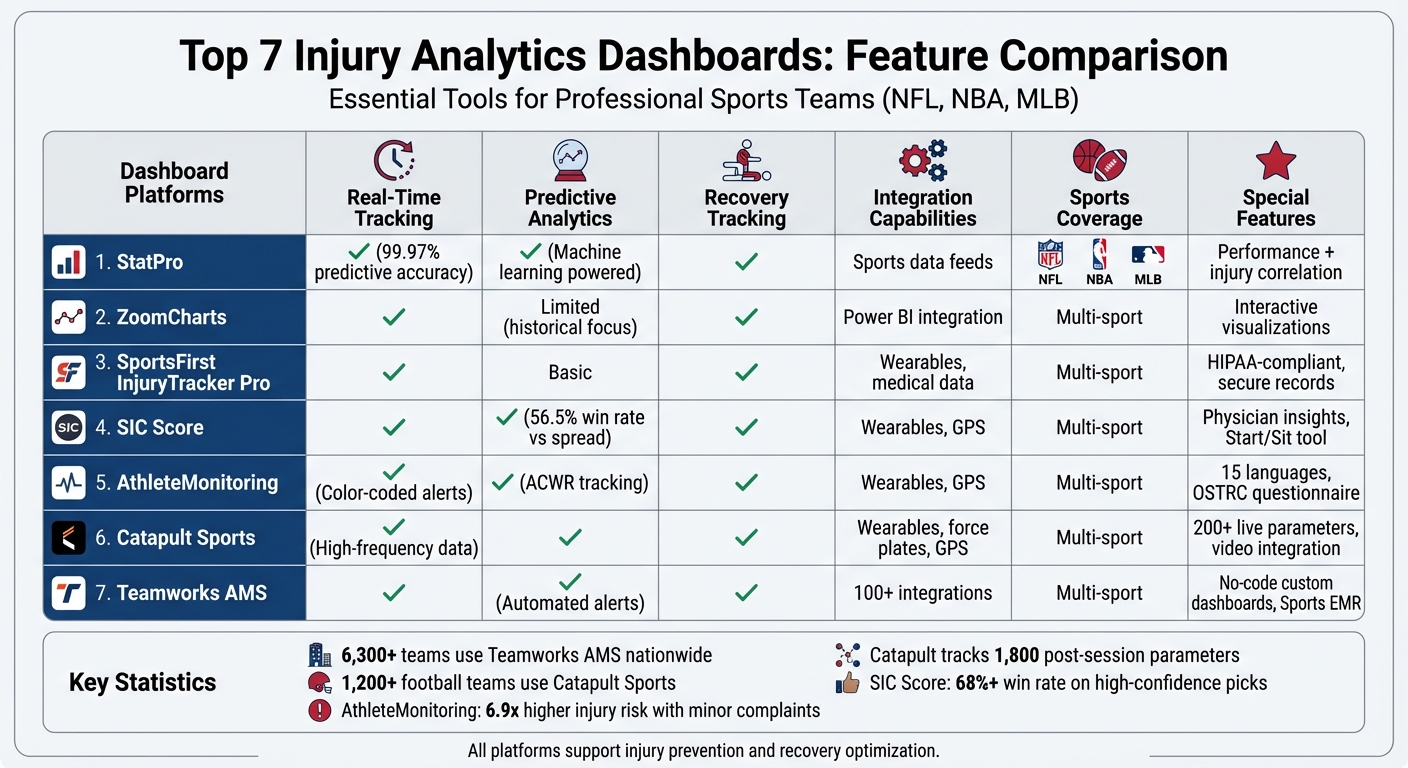
Top 7 Injury Analytics Dashboards Feature Comparison for Professional Sports Teams
Data Modeling in Power BI & Visualization of Sport Injuries Analysis
Quick Comparison
| Dashboard | Real-Time Tracking | Predictive Analytics | Recovery Tracking | Integrations | Sports Coverage |
|---|---|---|---|---|---|
| StatPro | Yes | Yes | Yes | Sports data feeds | NFL, NBA, MLB |
| ZoomCharts | Yes | Limited | Yes | Power BI integration | Multi-sport |
| SportsFirst InjuryTracker Pro | Yes | Basic | Yes | Wearables, medical data | Multi-sport |
| SIC Score | Yes | Yes | Yes | Wearables, GPS | Multi-sport |
| AthleteMonitoring | Yes | Yes | Yes | Wearables, GPS | Multi-sport |
| Catapult Sports | Yes | Yes | Yes | Wearables, force plates | Multi-sport |
| Teamworks AMS | Yes | Yes | Yes | 100+ integrations | Multi-sport |
Each platform offers unique strengths, making it easier for teams to manage player health and reduce injury risks. Choose based on your team's needs, budget, and desired features.
StatPro Injury Analytics Dashboard
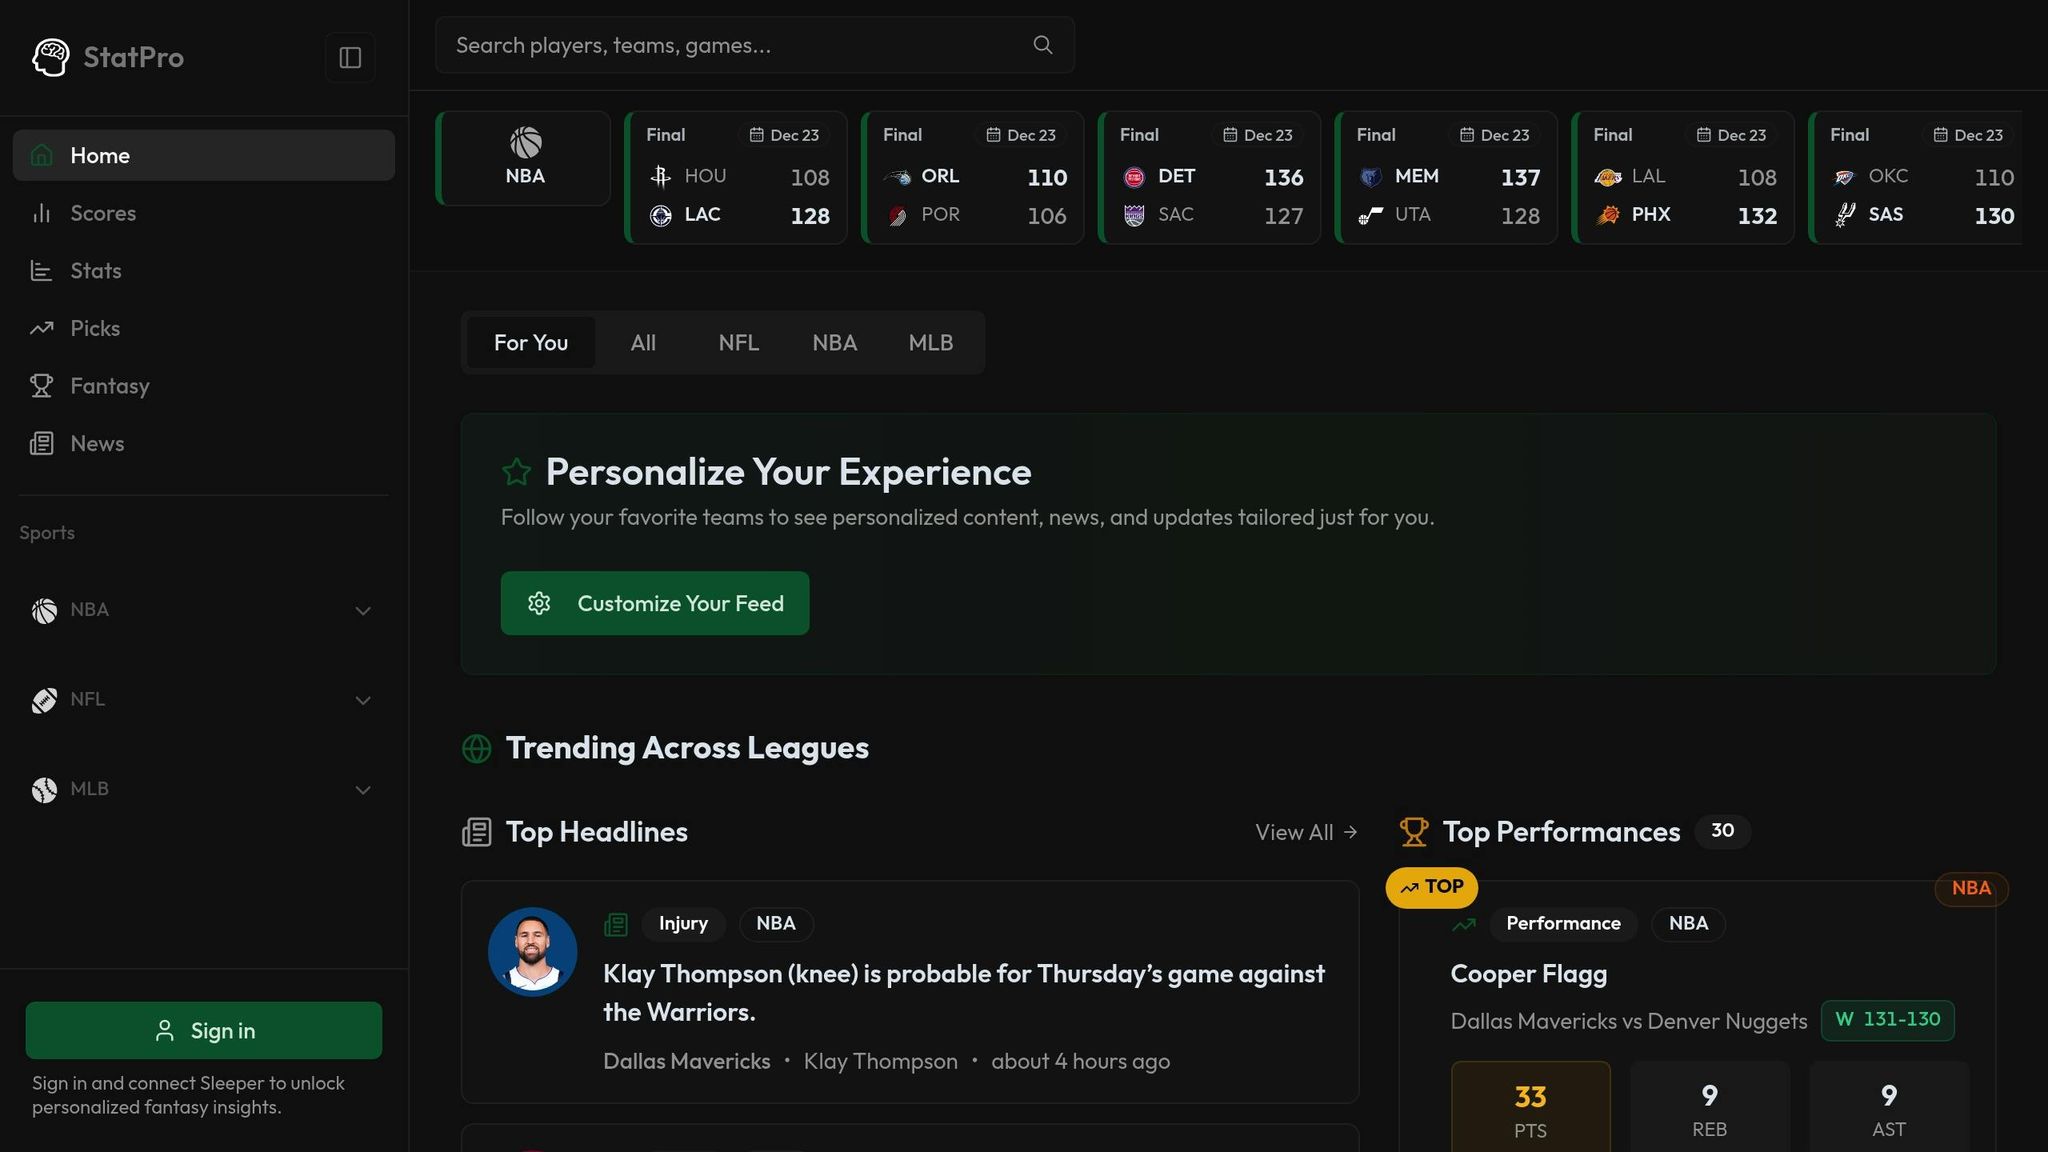
StatPro tackles the challenge of player availability with a streamlined, all-in-one dashboard designed for NFL, NBA, and MLB teams.
This platform combines injury tracking with performance analytics, offering real-time updates on player statuses like "out", "questionable", or "did not practice." This ensures teams have immediate insight into their rosters and can make informed decisions on the fly.
What sets StatPro apart is its ability to merge health data with performance stats. For NBA teams, it tracks critical metrics such as points, rebounds, assists, steals, and blocks, all while keeping tabs on injury reports. NFL teams get a similar advantage, monitoring performance indicators like receiving yards, touchdowns, and receptions, alongside detailed injury data - covering everything from calf strains and knee issues to concussions and ankle sprains. This comprehensive view helps teams understand how injuries might impact performance on the court or field.
The dashboard also offers a customizable feed, allowing staff to focus on specific players and teams by filtering out less relevant updates. It keeps track of roster changes - like signings, waivers, and assignments - and pulls in headlines from official team accounts for a complete picture. By pairing an athlete's injury history with recent performance data, StatPro supports smarter decisions about practice schedules, game-day readiness, and recovery plans.
ZoomCharts Sport Injury Analysis Dashboard

ZoomCharts takes Power BI integration to a new level in injury analytics, transforming raw health data into interactive visuals that coaches and medical teams can easily interpret. By using custom Power BI visuals that sync in real time, the platform eliminates the need for manual uploads, offering instant updates on injury trends. This seamless integration enables dynamic and detailed injury data analysis.
What makes this dashboard stand out is its multi-dimensional analysis capabilities. Teams can start with broad injury statistics and drill down into specifics - like identifying the most commonly injured body parts or pinpointing the causes behind certain injuries. The cross-filtering feature allows users to analyze injury patterns based on factors such as sport type, competition level, playing surface, age group, and gender. This helps staff identify high-risk areas with precision. Combined with StatPro’s real-time insights, the tool provides a thorough breakdown of injury data.
In August 2025, data analyst Abdulafeez Olamide Fakorede showcased the potential of Power BI by creating an Athlete Health & Injury Analysis dashboard during FP20 Analytics Challenge 29. His detailed three-page report examined injury trends by type and severity, tracked recovery effectiveness by drilling down from injury type to affected body part, and offered executive-level recommendations for cost and resource planning. The report utilized a star schema architecture and custom DAX measures to calculate metrics like "Recurrent Injury %" and "Most Effective Treatment".
The platform also tracks key performance indicators (KPIs) such as total injuries, average recovery time, recurrent injury rates, and common injury types. Financial metrics like "cost per day absent" and total treatment costs are included to highlight the economic impact of injuries. By analyzing these metrics, teams can identify which treatment methods lead to faster recoveries and implement those protocols across their medical staff.
Additionally, ZoomCharts supports risk prediction by analyzing performance trends for individual players and entire teams. This allows medical staff to detect early signs of overtraining and predict potential injury risks before they escalate. The system tracks injury incidence (new cases per athlete per year) and prevalence rates, showing the percentage of athletes facing health issues at any given time. These insights help teams proactively manage athlete health and minimize sidelining injuries.
SportsFirst InjuryTracker Pro
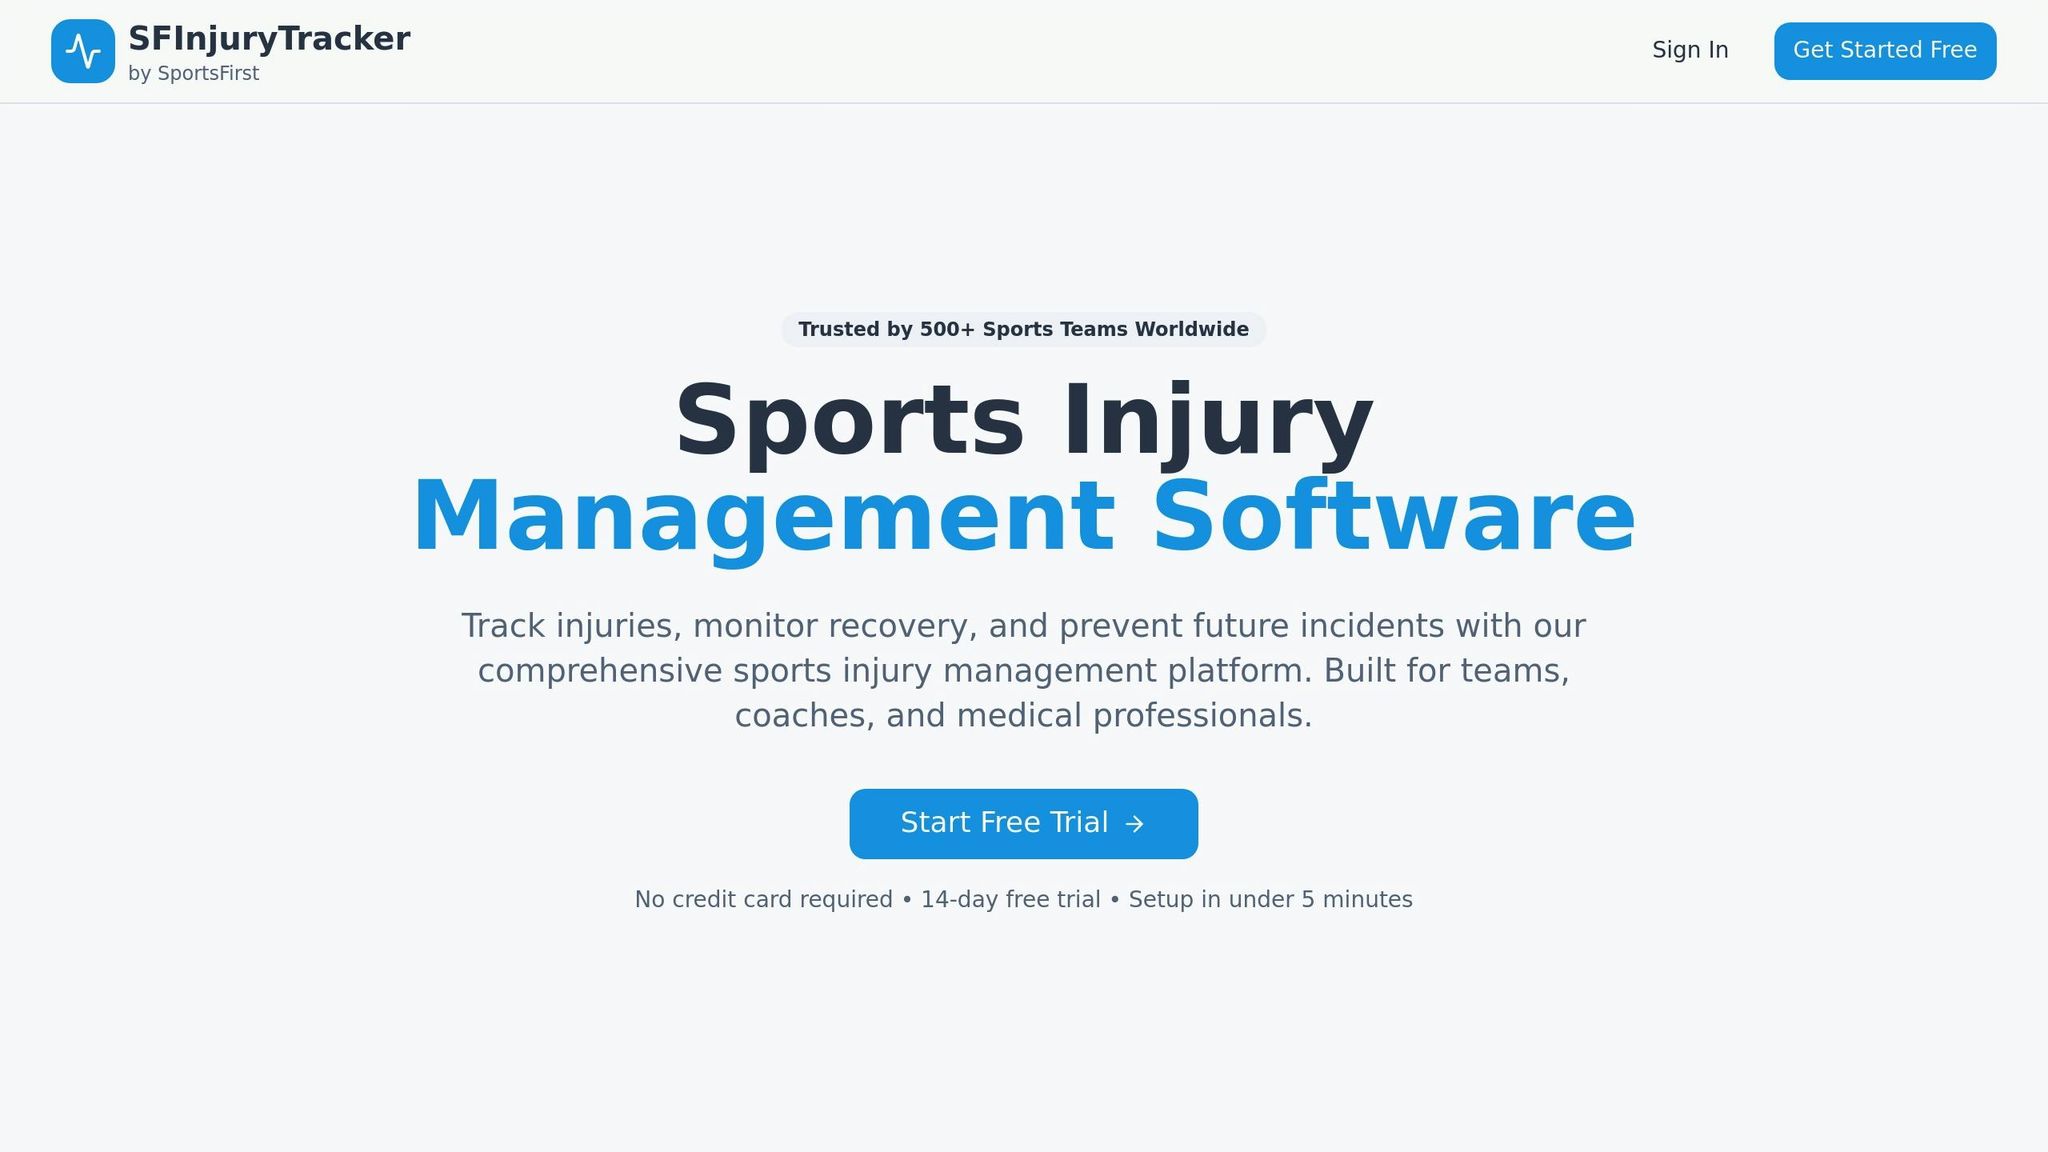
SportsFirst InjuryTracker Pro takes athlete care to the next level by focusing on secure record-keeping and streamlining workflows for better management.
This platform consolidates athlete medical records into a single, secure, HIPAA-compliant system. It handles everything from injuries and illnesses to mental health concerns, while also maintaining detailed SOAP notes and medical records.
The dashboard offers clear visualizations of injury patterns, tracks recovery timelines, and flags trends like training overload. These insights help teams shift from simply treating injuries to actively working on prevention strategies.
Customizable workflows make injury tracking more efficient. Coaches receive alerts about status updates, and the system supports return-to-play decisions with tailored reports and approval processes. Real-time notifications about risks and athlete availability ensure coaches are always informed about who’s ready for full participation and who might need adjusted training plans.
The platform also integrates seamlessly with external data sources. By pulling in data from third-party wearables like GPS trackers, heart rate monitors, and sleep trackers, it provides a more complete picture of athlete health. Automated reports track key metrics like injury rates, recovery times, and treatment success, helping teams make smarter decisions about staffing, resources, and injury prevention efforts.
SIC Score Player Insights Dashboard
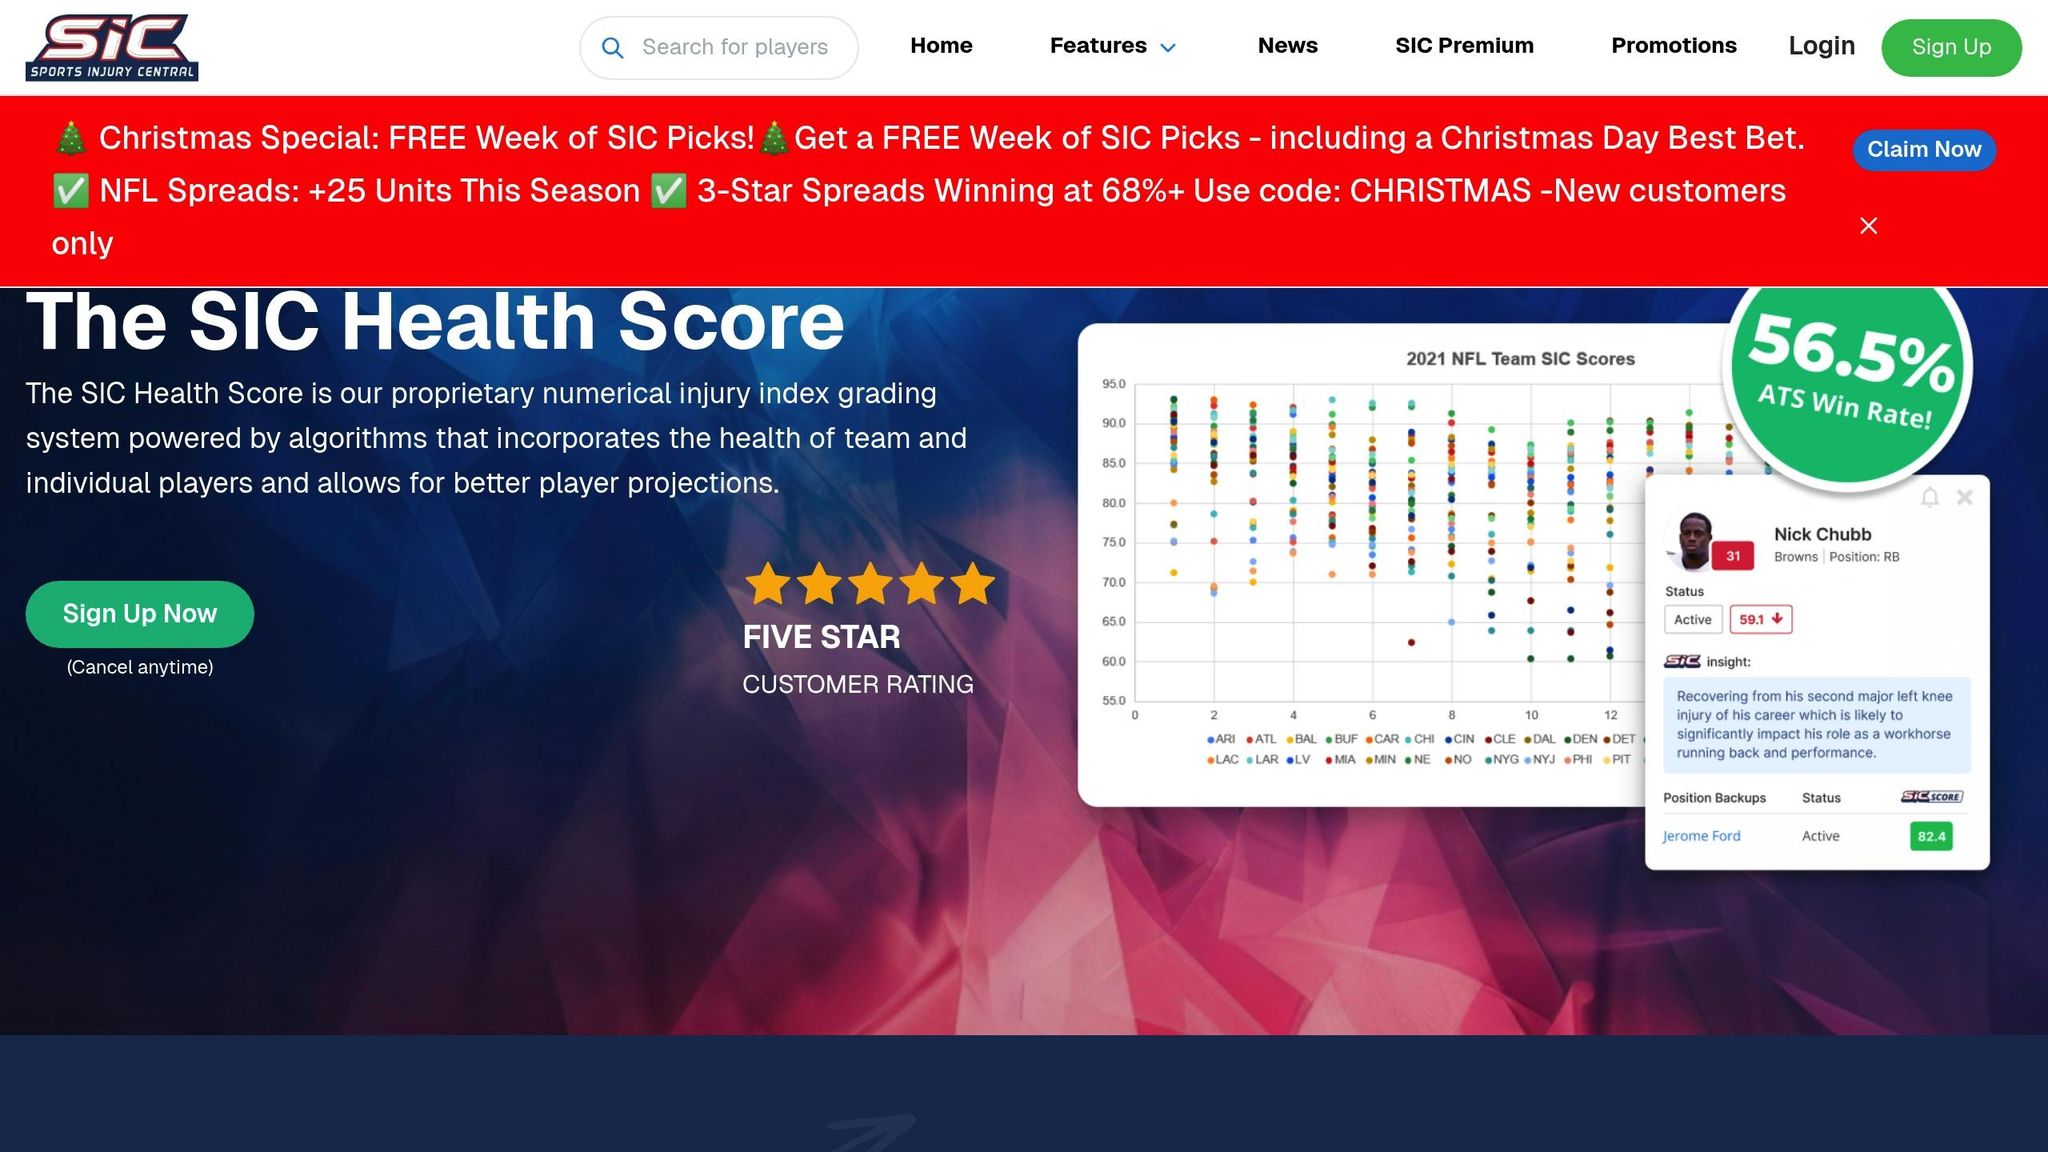
The SIC Score Dashboard offers a specialized injury index to evaluate the game readiness of players and teams across the NFL, NBA, and MLB.
What sets this dashboard apart is the expert input from former sports physicians. They analyze medical data and team reports, adding clarity to often vague or complex details. The system monitors key injury metrics such as InjuryStatus (Injured, Doubtful, Questionable, Probable), InjuryBodyPart, and InjuryStartDate. It even evaluates how injuries might influence specific matchups. These insights provide a direct link to performance outcomes.
Before games, the dashboard combines player, team, and opponent health data to fuel its "Start/Sit" tool, which predicts performance levels. The Field View Previews feature uses color-coded grades to show the health of starters and backups at every position, pinpointing vulnerabilities before the action begins. During games, real-time video analysis from doctors evaluates new injuries and their potential impact on team strategy.
The system’s track record speaks for itself: over the past five NFL seasons and three NBA seasons, it has achieved a 56.5% win rate against the spread. High-confidence "3-Star Spreads" have hit a winning rate of 68% or more, and its NFL SIC Picks are currently up by +25 units this season. Even legendary coach Bill Belichick, a six-time Super Bowl winner, has endorsed the platform:
"I always thought SIC's information was not only valuable but extremely accurate. You guys are great at it, you guys are absolutely great at it."
Access to the dashboard is tiered. Basic content is free with email sign-up, while full features like Player Insights, Team Health Scores, and SIC Picks are available through a subscription priced at under $10 per week.
AthleteMonitoring Dashboard
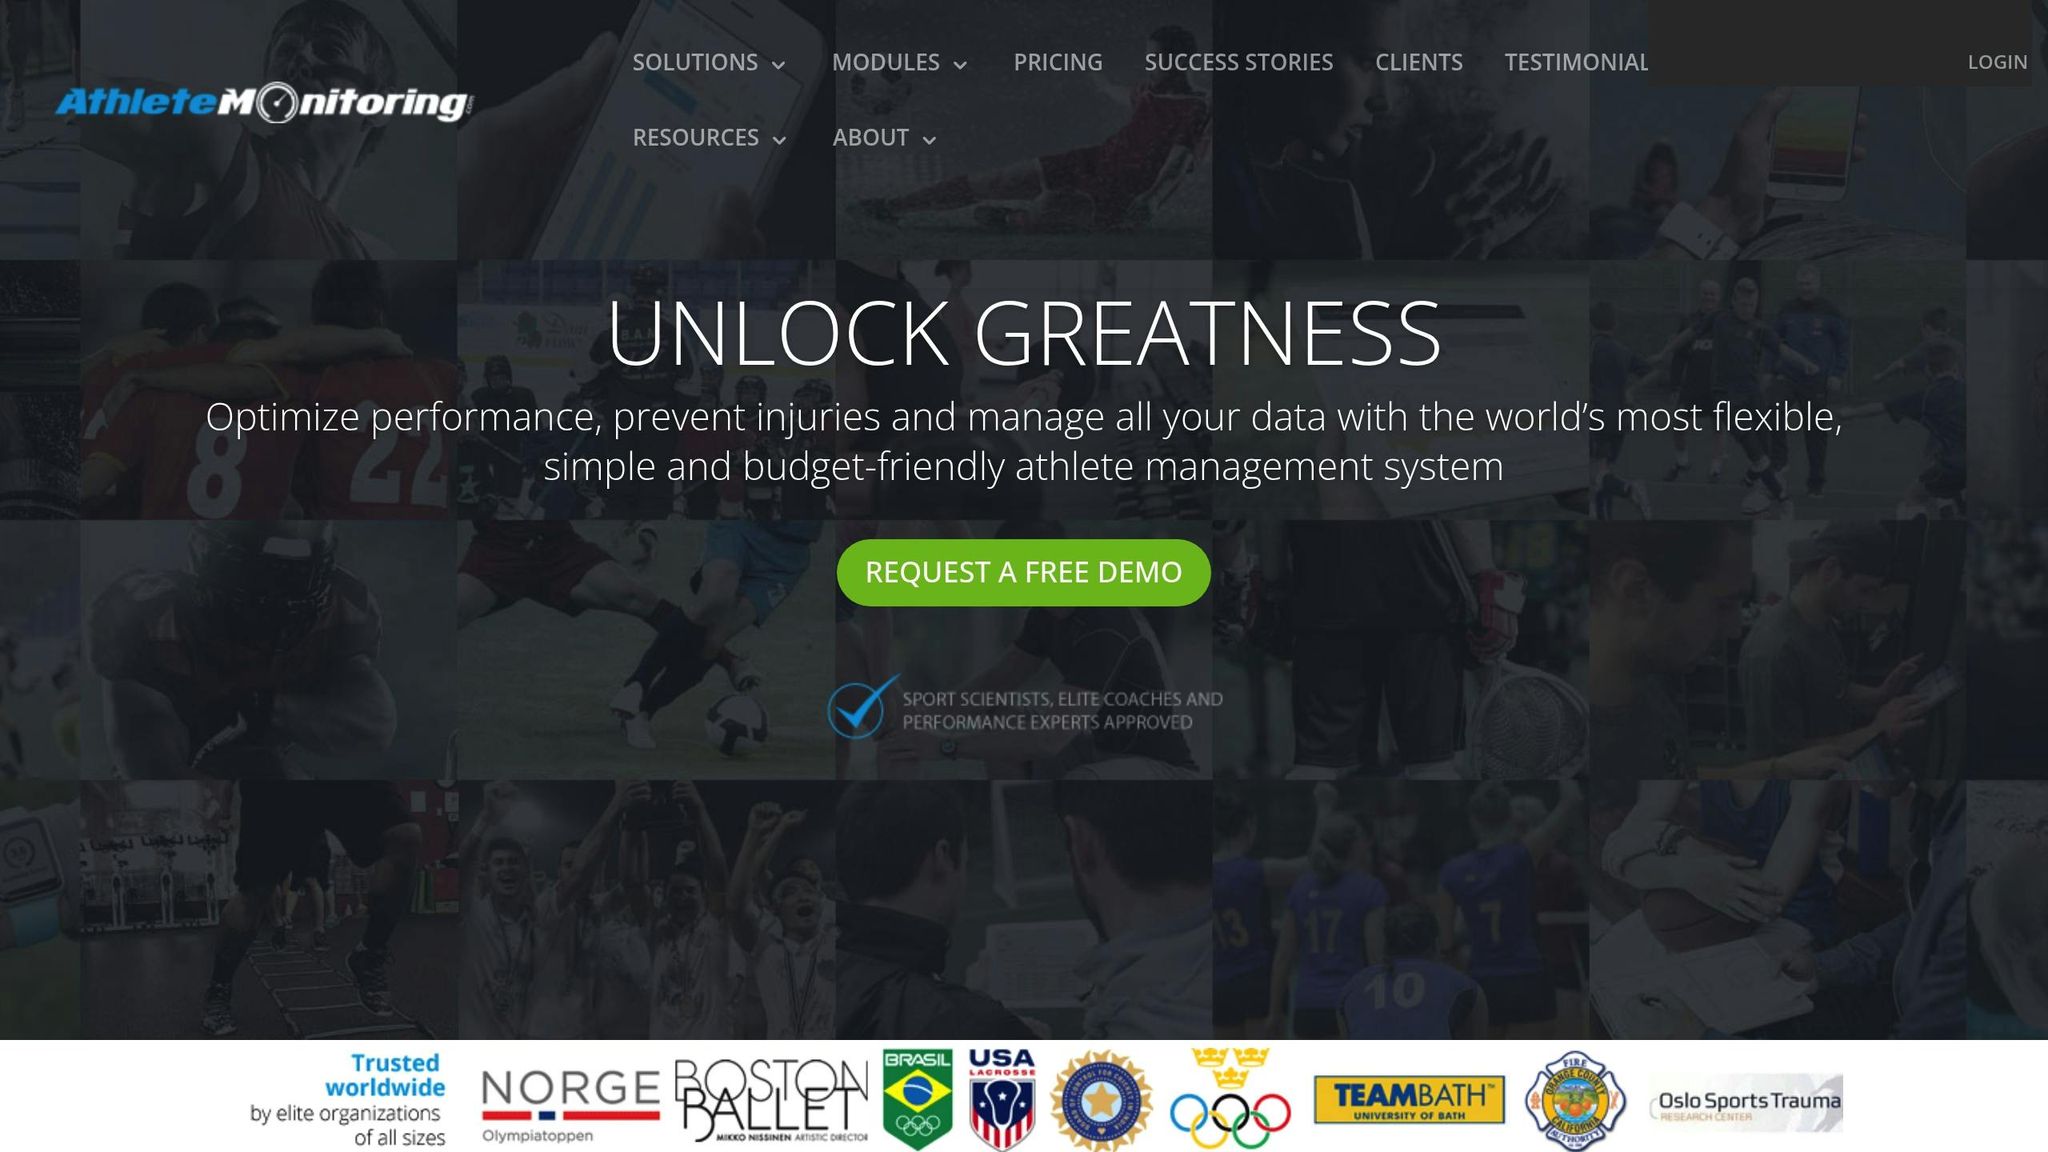
AthleteMonitoring takes integrated injury analytics to the next level by streamlining real-time data collection and risk assessment. It enables coaches and athletes to track wellness, training loads, and injury data in real time through a combination of athlete self-reports and coach inputs. The platform pulls together key metrics like fatigue, sleep quality, stress levels, and mood, alongside session RPE and wearable data, to deliver a holistic picture of an athlete's readiness and potential injury risks.
To simplify risk monitoring, AthleteMonitoring uses a color-coded alert system: red signals high risk, yellow points to poor workload management, blue indicates undertraining, and green represents optimal readiness. It also calculates the Acute:Chronic Workload Ratio (ACWR) over periods ranging from 7 to 28 days. An ACWR of 1.5 or higher flags a high risk of injury, while a ratio between 0.8 and 1.3 suggests an optimal training load. Additionally, any weekly workload increase exceeding 15% triggers a risk alert, helping staff stay proactive about injury prevention.
The platform incorporates the OSTRC questionnaire to identify overuse injuries and minor issues that could lead to more serious, time-loss injuries. According to research, athletes are 6.9 times more likely to experience a time-loss injury if they’ve reported "minor" or "moderate" complaints beforehand. AthleteMonitoring also tracks wellness scores as percentages, with scores above 80% prompting immediate workload adjustments to prevent overtraining.
"When it comes to monitoring your athletes' workload, AthleteMonitoring is the gold standard." - Jason Loukides, Head Wrestling Coach, All-Marine Wrestling Team
The platform is available in 15 languages and meets stringent data security standards, holding certifications such as HIPAA, GDPR, PIPEDA, and ISO/IEC 27001. Lars Haugvad, Physiotherapist for the Norwegian Olympic and Paralympic Program, emphasizes its importance:
"The success of our national health screening and monitoring program is dependent on a secure, adaptive and innovative system which AthleteMonitoring continuously provides us"
AthleteMonitoring also allows staff to personalize alert thresholds and access individual athlete dashboards. These dashboards provide tailored recommendations for workload adjustments based on current risk levels, ensuring a more focused approach to athlete care.
Catapult Sports Athlete Monitoring Dashboard
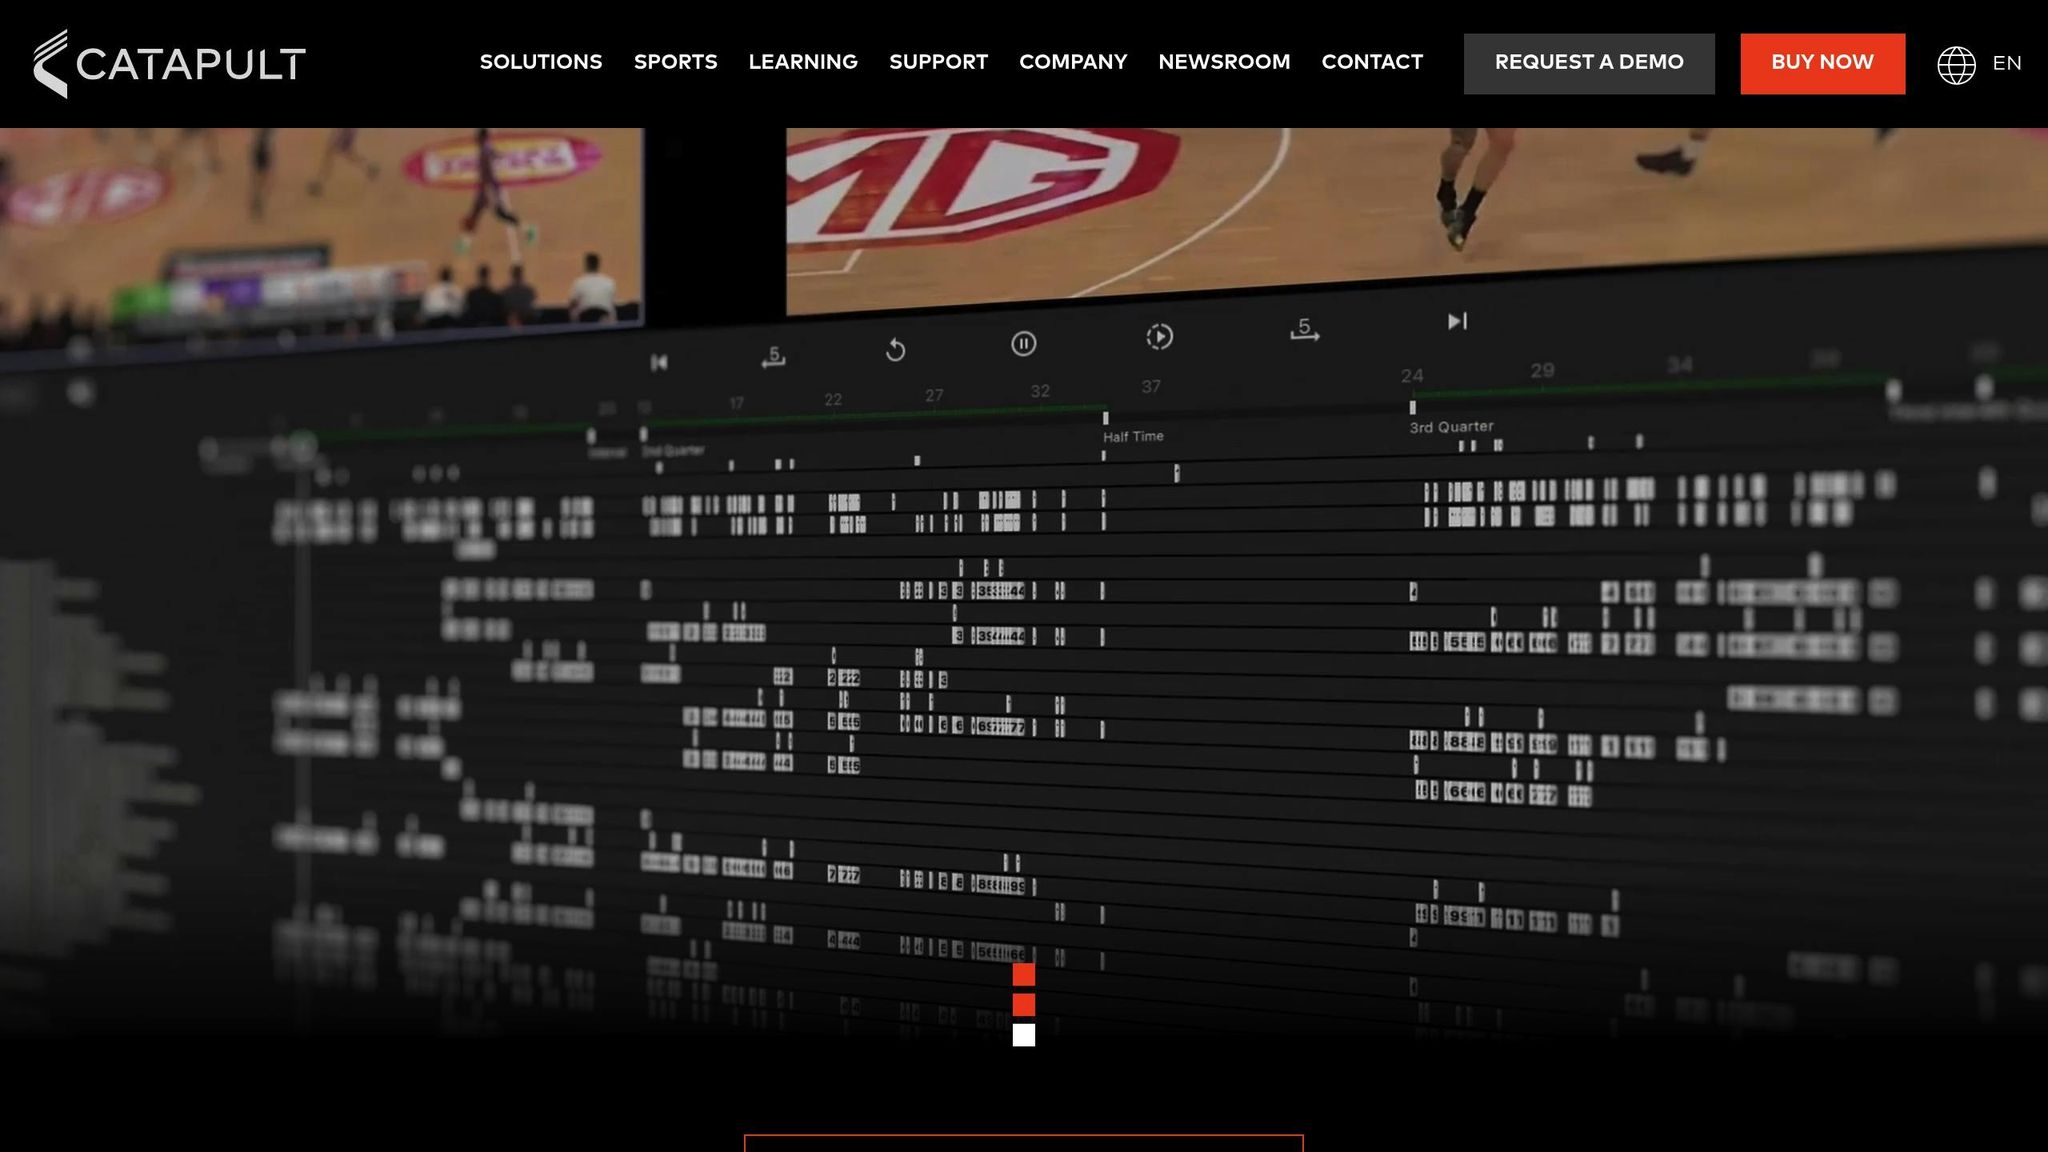
Catapult Sports combines wearable technology and advanced software to create a powerful athlete monitoring system. Their Vector devices (S7, X7, and Core) integrate seamlessly with the OpenField software platform, providing real-time insights that help teams reduce the risk of injuries. Over 1,200 football teams, including Real Madrid and Chelsea FC, use Catapult to keep players healthy and performing at their best.
The system goes beyond basic tracking by monitoring Player Load, using inertial sensors to measure acceleration and deceleration in three dimensions. This allows teams to quantify the physical stress athletes endure during training and games. For basketball, the Basketball Movement Profile algorithm categorizes movement into five one-second types (Active, Running, Dynamic, Jumping, Passive). Football-specific metrics, like Throw Count and Contact Load for quarterbacks or Contact Load % for linemen, address the sport's unique demands.
Catapult doesn't just provide raw data - it pairs it with visual analysis for deeper insights. Through its MatchTracker tool, teams can link sensor data with video footage to analyze specific movements, collisions, or tactics that generate high load metrics. Mathew Pearson, Head of Performance Insights & Data Strategy at Wolves F.C., highlights the efficiency:
"MatchTracker saves us up to the equivalent of a staff member in terms of time saved... we can pull all that together in 20 minutes and even go a step further to actually filter those goal kicks by outcome, type, distance etc."
The OpenField platform tracks 200 parameters live and 1,800 post-session when paired with Vector Core Plus. It offers customizable dashboards tailored to specific sports and positions. Additionally, it monitors Running Symmetry to detect imbalances and flags players with an Acute:Chronic workload ratio above 1.5, as these athletes face up to three times higher injury risk. With both outdoor GPS tracking and indoor Local Positioning Systems, the tool adapts to various training and competition environments.
Nick Potter, Director of High Performance & Sports Science at Duke University Men's Basketball, emphasizes the impact of this technology:
"Having this data is huge in so many ways. You never had a cell phone and it wasn't a problem. Now if you go to the store and forget your phone, it's like you are lost. Catapult is like that."
Teamworks AMS Dashboards
Teamworks AMS brings together performance, health, and medical data from over 100 different integrations into one centralized hub. Trusted by more than 6,300 teams nationwide, the platform offers a no-code tool for creating custom visualizations. This allows teams to merge data from wearables, performance tech, and even manual entries through digital forms. The result? A clear picture of injury risks and recovery trends, all in one place. This streamlined approach simplifies collaboration while keeping data secure.
With its permissions-based access control, the platform ensures sensitive medical data remains private while supporting teamwork. Medical staff can log injuries and treatment details in private workflows, while coaches only see relevant updates - like whether a player is available, on modified status, or unavailable for practice. Chris James, Football Operations Manager at Sydney Roosters (NRL), highlighted the benefits:
Prior to adopting Teamworks AMS, we were poor at managing performance data. We found that a lot of it was stored on separate systems, and we needed a solution to fix that. Teamworks AMS's customizable interface was a key appeal.
The system also includes a dedicated Sports EMR (Electronic Medical Record) module, complete with injury surveillance dashboards, medical screening tools, and VOMS (Vestibular/Ocular-Motor Screening) assessment features. Using "Embedded events", teams can link treatment notes directly to injury records, making data analysis faster and more efficient.
What sets Teamworks AMS apart is how it supports return-to-play decisions with precise, cross-functional insights. Automated alerts notify staff when a player's wellness or workload metrics fall outside their baseline, prompting immediate action. The platform is built with military-grade security, meeting ISO/IEC 27001:2013 and ISO/IEC 27701:2019 standards, and is fully HIPAA-compliant.
For added flexibility, teams can tap into a powerful API with R analytics and even integrate meal-event data through Teamworks Nutrition, creating a complete view of injury prevention and recovery.
Feature Comparison
When selecting an injury analytics dashboard, it’s essential to understand what each platform offers and how it aligns with the needs of NFL, NBA, and MLB teams. The table below compares seven systems based on key features that matter most to sports organizations.
| Dashboard | Real-Time Tracking | Predictive Analytics | Recovery Timeline Visualization | Integrations | Sports Coverage |
|---|---|---|---|---|---|
| StatPro Injury Analytics Dashboard | Yes; real-time updates on injuries and player status | Yes; includes performance insights and injury trend analysis | Yes; tracks recovery progress | Comprehensive sports data feeds | NFL, NBA, MLB |
| ZoomCharts Sport Injury Analysis Dashboard | Yes; offers interactive data visualization | Limited; focuses on historical data | Yes; includes visual recovery timelines | Standard data imports | Multi-sport |
| SportsFirst InjuryTracker Pro | Yes; live updates on injury status | Basic; identifies trends | Yes; tracks RTP (return-to-play) milestones | Supports wearables and medical system integration | Multi-sport |
| SIC Score Player Insights Dashboard | Yes; individual and team dashboards available | Yes; provides automated risk analyses and intelligent alerts | Yes; measures RTP programs and progress | Works with wearables, GPS, and external apps | Multi-sport; used by elite organizations worldwide |
| AthleteMonitoring Dashboard | Yes; real-time dashboards for teams and individuals | Yes; includes automated risk analyses and alerts | Yes; tracks RTP programs and progress | High compatibility; integrates with wearables, GPS, and external apps | Multi-sport; used by elite organizations worldwide |
| Catapult Sports Athlete Monitoring Dashboard | Yes; includes high-frequency data like heart rate, speed, and acceleration | Yes; integrates data into predictive platforms | Yes; tracks performance and recovery metrics | Compatible with GPS, wearables, and force plates | Multi-sport |
| Teamworks AMS Dashboards | Yes; provides real-time risk and availability signals | Yes; automated alerts for wellness and workload metrics | Yes; tracks RTP milestones and rehab progress | Over 100 integrations, including wearables and performance tech | Multi-sport |
But features are only part of the equation. Factors like update frequency, affordability, and AI-driven insights also influence a dashboard's value. For example, platforms that update every 5–10 minutes are ideal for time-sensitive decisions. This is especially crucial for the NFL, where gameday inactives are finalized 90 minutes before kickoff, or for MLB teams managing players on various injury lists (7-day, 10-day, 15-day, or 60-day) during the season.
Cost is another critical consideration. AthleteMonitoring offers a modular pricing model, letting teams pay only for the features they need. This approach makes advanced analytics accessible even for teams with tighter budgets.
AI-powered dashboards have also transformed injury prevention. With machine learning, these platforms can predict injury risks early - even with just one season’s worth of structured data. This technology provides real-time risk signals and automates workflows that weren’t feasible just a few years ago. Combined with the features listed above, these advancements help teams choose the dashboard that best fits their needs and resources.
Conclusion
Injury analytics dashboards have completely changed the way professional sports teams manage player health and performance. What was once a reactive process of record-keeping has evolved into a proactive, data-driven approach designed to minimize injury risks and speed up recovery times. Kitman Labs puts it well:
The real measure isn't features - it's outcomes: fewer injuries, faster recoveries, safer return to play.
Among these tools, StatPro's Injury Analytics Dashboard stands out. By leveraging machine learning, it achieves an impressive 99.97% predictive accuracy, correlating spatial tracking data with variables like field type, weather conditions, player positions, and injury types. This allows teams to pinpoint high-risk scenarios before they escalate into significant problems.
Other platforms, such as AthleteMonitoring, Teamworks AMS, and Catapult Sports, bring their own strengths to the table. From risk visualization and comprehensive data integration to real-time load tracking, these solutions cater to a variety of team needs, as highlighted in their feature comparisons.
Choosing the right dashboard depends on your team's specific goals. Whether you're focused on making split-second gameday decisions, predicting risks before they materialize, or carefully tracking recovery progress, the right tool can make all the difference. For teams like those in the NFL and MLB, where managing player statuses across different injury list durations is critical, real-time data integration is non-negotiable.
At its core, the best injury analytics dashboard is more than just a tracking tool. It’s a system that helps prevent injuries, streamlines recovery, and ensures players return to action only when they're fully ready. With insights like the "Twist" factor - showing 98% predictive importance in concussion analysis - teams now have access to intelligence that was once out of reach. These advancements are reshaping the future of player safety and performance.
FAQs
How can injury analytics dashboards help reduce and prevent sports injuries?
Injury analytics dashboards give teams a real-time snapshot of an athlete's health and performance, making it easier to spot potential risks before they become serious issues. By pulling together data like training loads, wellness surveys, medical check-ups, and recovery updates, these dashboards allow coaches and medical teams to track patterns and catch early warning signs - like rising fatigue or signs of overtraining.
With tools like color-coded risk alerts and automated notifications, teams can take action right away. This might mean tweaking training routines, updating recovery plans, or scheduling a medical check-in. These dashboards also improve communication across the staff, keeping everyone on the same page so athletes get the care they need, when they need it. The payoff? Fewer injuries, quicker recoveries, and athletes who are ready to perform at their peak all season long.
What features should teams prioritize in an injury analytics dashboard?
When selecting an injury analytics dashboard, it's crucial for teams to focus on features that simplify decision-making and deliver useful insights. A dashboard that acts as a centralized hub for athlete health data - covering everything from medical records to treatment plans and wellness assessments - helps ensure everyone is on the same page. Plus, having real-time risk alerts that combine training loads, medical stats, and wellness data can be a game-changer in spotting potential injuries before they occur.
Another important factor is customizability. Teams should be able to adjust graphs, thresholds, and layouts to meet their unique needs. Features like automated updates and alerts save time by cutting down on manual tasks and improving communication. Meanwhile, intuitive visualizations, such as color-coded risk indicators, make it easier to identify trends and act quickly.
StatPro’s injury analytics dashboards bring all these elements together, enabling teams to make smarter decisions, reduce injury risks, and help athletes return to action faster.
How do injury analytics dashboards work with wearable technology?
Injury analytics dashboards work hand-in-hand with wearables like GPS trackers, accelerometers, heart rate monitors, and sleep trackers. These devices transmit data securely through APIs, allowing it to sync automatically with the platform. Once synced, the dashboards transform this raw data into useful metrics like distance covered (in miles), heart rate (beats per minute), and sleep quality scores.
This real-time stream of information gives coaches a clear view of an athlete’s readiness and highlights potential injury risks using easy-to-read, color-coded indicators (like red for high risk). By blending wearable data with additional sources such as medical records and wellness surveys, these dashboards offer a comprehensive view of an athlete's health. This enables teams to fine-tune training regimens, avoid overtraining, and accelerate recovery when needed.