Top 5 NFL Stats Every Fantasy Owner Should Track
Unlock fantasy football success by tracking key stats like target share, red zone efficiency, and more to optimize your lineup decisions.
Winning your fantasy football league isn’t about luck - it’s about understanding which stats truly matter. The best managers focus on data that predicts future performance, not just flashy highlights or last week’s numbers. Here's a quick guide to the five most impactful NFL stats for fantasy football success:
- Target Share: Shows how often a player is involved in their team’s passing game, helping you spot reliable options and potential breakouts.
- Red Zone Efficiency: Tracks how well players convert scoring chances into touchdowns, a key driver of fantasy points.
- Yards After Catch (YAC): Highlights players who maximize their opportunities by turning short plays into big gains.
- Snap Count & Usage Rate: Reveals how often a player is on the field and involved in plays, crucial for spotting role changes or rising stars.
- Touches & Opportunities: Measures workload, helping identify players with consistent chances to score.
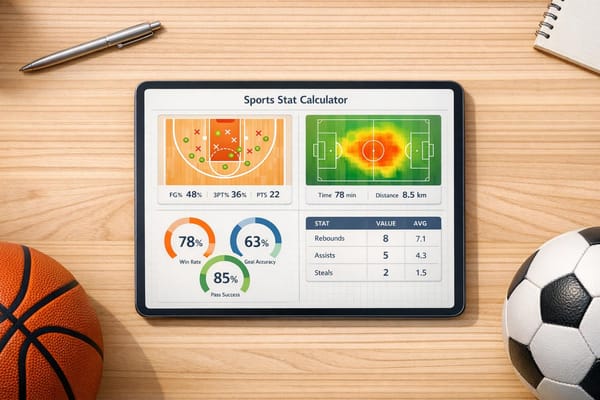
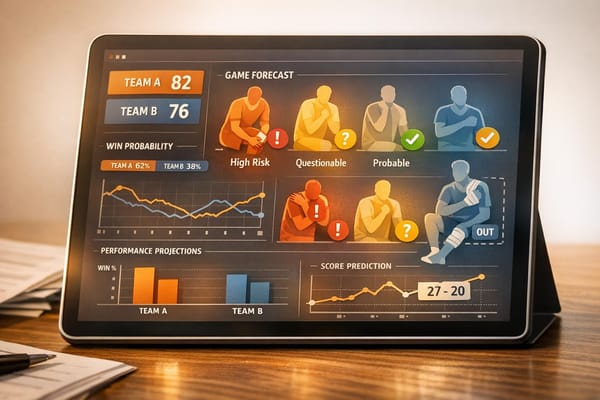
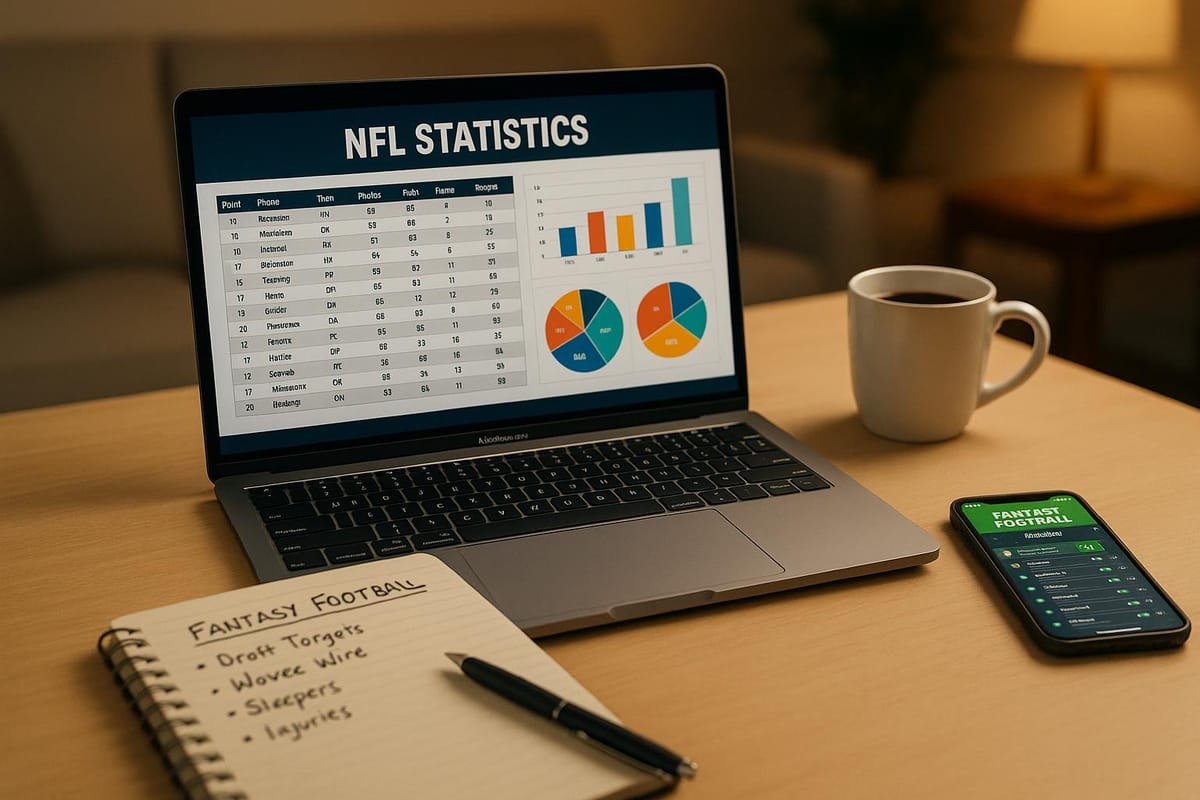
These metrics are directly tied to fantasy performance and can help you make smarter lineup decisions, pick the right waiver wire targets, and dominate your league. Tools like StatPro make tracking these stats simple with real-time updates and easy-to-read dashboards.
What Are the SECRET Fantasy Football Stats You Need to WIN in 2025?
1. Target Share
Target share measures the percentage of a team's total passing attempts that go to a specific player. It cuts through week-to-week variability to highlight how central a player is to their team's offensive strategy.
Why Target Share Matters for Fantasy Football
Target share is a big deal in fantasy football because it directly ties to a player’s opportunities. A wide receiver with a high target share or a running back heavily involved in the passing game is more likely to rack up catches, yards, and touchdowns - key contributors to fantasy points.
It’s also a great indicator for spotting trends. If a player is putting up big fantasy numbers but only seeing a small percentage of targets, that production might not last. On the flip side, a player with a high target share but lackluster results could be due for a bounce-back, making them a potential buy-low candidate.
Using Target Share for Weekly Decisions
Target share is incredibly useful when setting your lineup or evaluating matchups. It helps you make smarter start/sit decisions by identifying players who remain heavily involved in their team’s offense, even against tough defenses. For example, a player with a consistent target share in the passing game offers a safer floor, even if their team is up against a strong run defense.
Injuries also shake up target distribution. When a team’s primary receiver goes down, other players often see an increase in targets, creating new opportunities. Fluctuations in target share can also reflect game flow - teams leading by a large margin might lean more on the run, while players with steady target shares are more reliable week to week.
Spotting Trends and Gaining an Edge
Tracking target share over multiple games helps you identify trends. If a player’s target share is climbing, it likely means they’re gaining the trust of their coaching staff, which could translate to better fantasy production.
Red zone target share is another key area to watch. Players who get more looks near the goal line have a higher chance of scoring touchdowns, boosting their value. Pairing target share data with other metrics like air yards adds even more context. For instance, a player with a strong target share and deep-field opportunities is primed for explosive performances.
Keeping an eye on real-time target share updates can give you an edge when making roster decisions or analyzing matchups each week.
2. Red Zone Efficiency
Red zone efficiency measures how effectively players turn scoring opportunities into points when operating between the opponent's 20-yard line and the goal line.
Why It Matters for Fantasy Football
In fantasy football, red zone efficiency plays a huge role because touchdowns are one of the biggest contributors to fantasy points. Consider this: quarterbacks throw touchdown passes on 23.4% of red zone attempts, compared to just 1.6% on plays outside the red zone. For running backs, the numbers are even more striking - 42% of touches inside the green zone (the area within the opponent's 5-yard line) result in touchdowns. The connection between red zone attempts and fantasy success is clear, with correlations of 74% for quarterbacks and 81% for running backs in PPR formats.
Using Red Zone Efficiency for Matchups and Roster Choices
Keeping tabs on red zone efficiency can help you spot players who consistently get - and capitalize on - key scoring opportunities. This is crucial when analyzing weekly matchups or setting your lineup. Players with defined roles in red zone situations are far more likely to deliver steady touchdown production. When paired with other metrics, red zone efficiency becomes a powerful tool for making smarter roster decisions and gaining an edge in weekly matchups.
3. Yards After Catch (YAC)
Yards After Catch (YAC) measures the additional yards a player gains after making a reception. It highlights a player's ability to turn short catches into impactful plays.
Why YAC Matters for Fantasy Football
YAC is a game-changer for fantasy football. Every extra yard a player picks up after a catch directly adds to their fantasy points. Wide receivers with strong YAC skills often exceed expectations, while running backs can rack up extra yardage on screen passes and short throws. This metric doesn't just affect season-long totals - it can also swing weekly matchups in your favor.
How YAC Impacts Weekly Matchups and Lineups
Paying attention to YAC trends can give you a competitive edge. Players facing defenses that struggle to limit yards after the catch are more likely to have big games. Identifying these matchups can help you make smarter start/sit decisions, especially when you're looking for players with the potential for explosive plays.
Using YAC to Spot Trends and Make Moves
Changes in YAC can reveal shifts in a player's role or effectiveness. For example, a rising YAC alongside consistent targets might point to a breakout performance on the horizon. On the flip side, a decline in YAC could indicate a drop in efficiency. Keep an eye on this metric along with others to make timely roster adjustments and stay ahead of your competition.
4. Snap Count and Usage Rate
Snap count tracks how often a player is on the field during a game, while usage rate measures how frequently they handle the ball. Together, these metrics shed light on a coach's confidence in a player and hint at their fantasy football potential.
Relevance to Fantasy Player Performance
Players who are involved in a large chunk of their team's snaps generally offer more consistent fantasy value. For example, running backs who are on the field for a high percentage of snaps have more chances to rack up points compared to those who see limited action. On the other hand, usage rate focuses on how often a player gets the ball. Even if a player doesn’t have a high snap count, a strong usage rate can indicate they’re worth a fantasy roster spot.
If a player’s snap percentage suddenly increases over a short period, it might signal a bigger role in the offense moving forward. Picking up on these trends early can help fantasy managers identify breakout players on the waiver wire before others catch on. These insights also tie into how game situations influence snap opportunities.
Impact on Weekly Matchups and Roster Decisions
Snap counts are also influenced by game flow. For instance, teams that are trailing tend to pass more, creating more opportunities for receivers while limiting touches for running backs. Injuries can also shake things up, forcing teams to divide snaps among backups. Keeping an eye on these changes is crucial for making smart weekly roster decisions.
Availability of Actionable Insights and Trends
An uptick in snap count, even without immediate fantasy production, often hints at a player’s growing role in the offense. On the flip side, a steady drop in snap percentage might reflect a strategic change that reduces their involvement.
Additionally, tracking situational snap counts - like those in red zone packages - can reveal which players are prioritized near the goal line. If a player begins to see more red zone snaps, they may become a valuable option for touchdown-dependent plays. By paying attention to these trends over the course of a season, you can anticipate changes in player roles before they show up in the box scores.
5. Touches and Opportunities
Touches and opportunities measure how often a player gets their hands on the ball during a game. For skill position players, this includes rushing attempts, receptions, and targets. Generally, the more touches a player gets, the more fantasy points they’re likely to score. Players with consistently high touch counts are often more dependable fantasy options compared to those with fewer chances. This metric is key to evaluating a player's workload and potential scoring output.
Relevance to Fantasy Player Performance
More touches often mean more points. For example, a running back getting 15–20 carries per game is far more reliable than one with only 8–10 touches, even if their efficiency varies.
Opportunity share, which measures a player’s percentage of team touches, is another critical factor. A running back who handles 60% of their team's rushing attempts holds strong fantasy value, even if their team overall struggles. This metric can help pinpoint players who might be undervalued due to their team’s performance but are heavily utilized individually.
Coaching strategies also play a big role in touch distribution. Some coaches prefer a “bell-cow” running back who handles most of the workload, while others favor splitting touches among multiple players in a committee approach. Understanding these tendencies helps predict which players will maintain consistent opportunities throughout the season.
Impact on Weekly Matchups and Roster Decisions
Game script can heavily influence how touches are distributed. Teams trailing early often shift to a pass-heavy strategy, reducing running back opportunities while increasing targets for receivers. On the flip side, teams playing with a lead tend to run the ball more to manage the clock, increasing opportunities for running backs but limiting receiver targets.
Injuries also create sudden shifts in opportunity. When a lead running back is sidelined, backup players often see their workload skyrocket. Similarly, if a top receiver misses time, remaining pass catchers usually absorb the extra targets. Savvy fantasy managers can capitalize on these changes to gain an edge.
Availability of Actionable Insights and Trends
Tracking trends in touch volume can reveal valuable insights. For example, if a running back’s carries rise from 12 to 16 to 19 over three weeks, it’s a sign they’re gaining trust from the coaching staff and may see even more opportunities moving forward. On the other hand, a declining touch count could indicate reduced confidence or the emergence of a committee system.
Red zone touches are particularly important since they often lead directly to touchdowns. Players who consistently get goal-line carries or targets inside the 20-yard line have a higher scoring ceiling compared to those who don’t see much action in these areas. This can be a deciding factor when choosing between similarly productive players for your lineup.
Seasonal trends in touch volume often reflect broader team dynamics. Playoff-bound teams may rely more heavily on their veteran players late in the season, while teams out of contention might shift focus to younger players to assess their potential. Recognizing these patterns early can help you make timely roster adjustments and uncover hidden gems on the waiver wire.
Stats Comparison by Position
Fantasy football success hinges on understanding how different positions rely on specific stats. Wide receivers, running backs, tight ends, and quarterbacks each benefit from unique metrics that influence their fantasy point production. These position-based insights build on earlier discussions about individual metrics, offering more tailored advice for managing your roster.
Wide Receivers
For wide receivers, target share and overall volume are key drivers of fantasy performance. Targets have a staggering 95% correlation with PPR fantasy points for this position. Another valuable metric is the Weighted Opportunity Rating (WOPR), which combines target share with air yards market share. WOPR shows an 83% correlation to PPR fantasy points, making it an essential tool for evaluating wide receivers.
Running Backs
Running backs thrive on implied touches, which show a 92% correlation to PPR fantasy points. Red zone efficiency also plays a critical role. For instance, green zone touches - those within the opponent's 5-yard line - correlate 81% with PPR fantasy points. Interestingly, running backs score touchdowns on about 42% of their green zone touches, compared to just 13.1% for touches between the opponent’s 6-10 yard line.
Tight Ends
Tight ends share similarities with wide receivers when it comes to metrics. For example, routes run have a 91% correlation to PPR fantasy points. Other key metrics, such as targets and target share, also closely align with those of wide receivers, emphasizing the importance of opportunity-based stats for tight ends.
Quarterbacks
Quarterbacks rely heavily on red zone performance. Red zone passing attempts show a 74% correlation to PPR fantasy points. Additionally, quarterbacks throw touchdown passes on 23.4% of their red zone attempts, compared to just 1.6% for passes made outside the red zone. This highlights the importance of capitalizing on red zone opportunities for quarterbacks.
Each position leans on distinct metrics to maximize fantasy value. Wide receivers and running backs benefit from high-volume opportunities, while quarterbacks and tight ends rely more on efficiency and red zone success. These position-specific correlations provide a clearer picture for making smarter roster and matchup decisions.
Conclusion
Mastering these five key NFL statistics can elevate your fantasy football strategy from guesswork to precision. Target share pinpoints players who consistently see opportunities, while red zone efficiency identifies those most likely to deliver touchdowns when it counts. Yards after catch separates dynamic playmakers from steady possession receivers, and snap count and usage rate provide early clues about role changes or possible injury risks. Lastly, monitoring touches and opportunities helps you uncover emerging stars and predict shifts in workload before others catch on. These metrics are closely tied to fantasy performance, giving you the tools to make smarter, data-driven lineup decisions.
StatPro's analytics platform takes this a step further by simplifying the process. It eliminates the need for manual calculations, presenting all the critical stats in clear, user-friendly dashboards. With real-time updates, you’ll always have the most current data at your fingertips - whether you’re debating a waiver wire pickup or deciding who gets the flex spot in your lineup. In fantasy football, the difference between winning and losing often comes down to the quality of your information. By focusing on these crucial metrics and using StatPro's tools, you can consistently spot undervalued players, avoid fading assets, and optimize your lineup every week. This approach gives you a serious edge in every matchup.
FAQs
Why is tracking target share important for spotting breakout players in fantasy football?
Tracking target share is an essential tool for spotting breakout players because it reveals how frequently a player is involved in the passing game. When a player has a high target share, it’s a strong indicator that they’re a central piece of their team's offensive plan. And that often leads to more chances for receptions, yards, and touchdowns.
Paying attention to players whose target shares are climbing - especially in favorable matchups - can help you identify rising stars or overlooked talents that others might miss. This knowledge gives you an edge when setting your lineup and staying one step ahead of the competition.
How does red zone efficiency impact a player's fantasy potential, and how can I use it to make better lineup decisions?
Red zone efficiency is a critical stat in fantasy football. It shows how often a player turns opportunities near the end zone into touchdowns. Players who excel in this area are more likely to rack up points, making them valuable additions to your lineup.
To make smarter weekly decisions, keep an eye on how often your players are targeted or involved in red zone plays. Focus on starting those who consistently get these chances - they’re more likely to deliver big fantasy performances. This approach can help you fine-tune matchups and boost your overall scoring potential.
How can tracking snap counts and usage rates help me spot breakout players or role changes early?
Tracking snap counts and usage rates is a smart way to gain an edge in fantasy football. These metrics show how often a player is on the field and how involved they are in the offense. When you notice a player's snap count rising or their share of team touches increasing, it often hints at a bigger role on the horizon.
Take this scenario: a backup running back starts getting more snaps and touches during games. This could be an early sign of a breakout or a shift in the team's depth chart. By spotting these trends early, you can make quick roster adjustments and stay ahead of your competition before they catch on.