
How to Read NBA Player Efficiency Ratings
Learn how Player Efficiency Rating (PER) quantifies player contributions in basketball, offering insights into performance across roles and eras.
Player Efficiency Rating (PER) simplifies a basketball player’s contributions into a single number, making it easier to compare players across different roles, teams, and eras. The league average is always set to 15.00, with higher scores indicating better performance. PER accounts for both positive stats (like points, assists, and rebounds) and negative ones (like missed shots and turnovers), while adjusting for playing time and team pace.
Key Points:
- 15.00 is the league average each season.
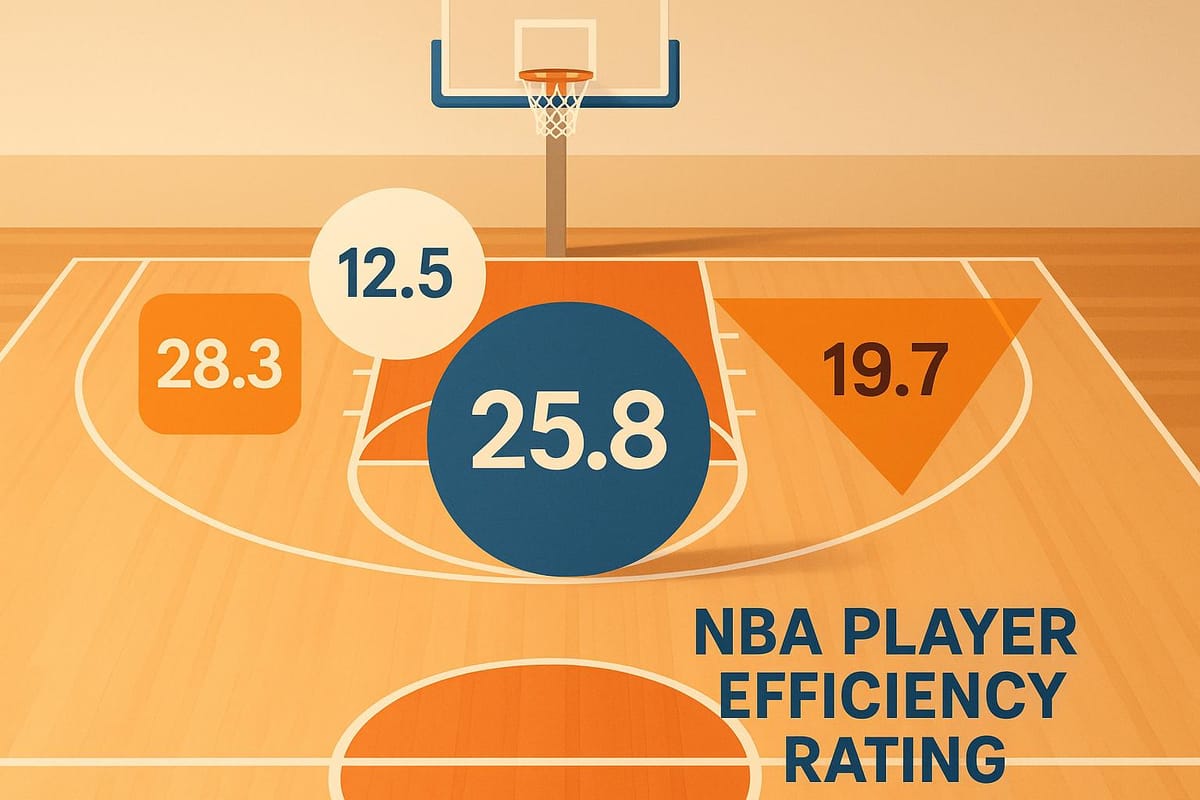
- Below 10.0: Minimal impact or struggling players.
- 10.0–15.0: Role players or average performers.
- 15.0–20.0: Above-average starters or key contributors.
- 20.0+: Star-level performance.
- 25.0+: MVP-level seasons.
- 30.0+: Historic, rare performances.
PER is calculated per minute, making it fair for comparing starters and bench players. However, context matters - factors like position, team style, and matchups influence PER. Use it with other stats for a well-rounded evaluation of player impact.
What Is "Player Efficiency Rating" and Does It ACTUALLY Work?
What PER Measures and How It Works
PER, or Player Efficiency Rating, dives deep into the numbers to evaluate a player's overall impact on the game. It takes into account a wide range of contributions while also considering the context in which those contributions occur.
Core Statistics in PER
At its core, PER pulls from all the major box-score stats, assigning weights to reflect their importance in winning games. Positive contributions include scoring points through field goals, free throws, and three-pointers, as well as assists, rebounds (both offensive and defensive), steals, and blocks. These are the actions that directly push a team toward success.
On the flip side, PER doesn't ignore the negatives. Missed shots, turnovers, and personal fouls are factored in as deductions, ensuring the rating reflects a player's ability to help their team while minimizing costly mistakes. Take Draymond Green, for instance. While he may not light up the scoreboard, his ability to rack up rebounds, assists, steals, and blocks - all while keeping turnovers low - can lead to a strong PER that highlights his overall value to the team.
Next, let’s look at how PER balances these contributions with weighting and pace adjustments.
How Stats Are Weighted and Pace Adjusted
Not every stat carries the same level of importance, and PER accounts for this. For example, field goals made and assists are weighted more heavily than defensive rebounds because they have a greater influence on the game's outcome. On the other hand, turnovers are penalized more than missed shots, as they represent a lost possession for the team.
Pace adjustment is another critical element, ensuring fair player comparisons across different team styles. Fast-paced teams, like the Golden State Warriors, naturally generate more stats because they have more possessions in a game. Without adjusting for pace, players on these teams would appear more productive compared to those on slower, methodical teams. By normalizing for pace, PER ensures that players are judged on their efficiency rather than the speed of their team's play.
The League-Average Benchmark
To make PER easier to interpret, it’s standardized to a league average of 15.00, recalibrated every season. This benchmark provides a clear reference point:
- A PER above 15.00 indicates better-than-average performance.
- A PER below 15.00 signals below-average play.
- Elite players often post PERs above 20.00, while truly dominant seasons can see scores of 25.00 or more. Bench players or those struggling with their roles might fall into the single digits or low teens.
This 15.00 baseline also allows for historical comparisons. For example, a player with a 22.0 PER in 2010 would be evaluated at a similar level relative to their peers as a player with a 22.0 PER today. This makes PER a valuable tool for comparing players across different eras and playing styles.
How to Read and Interpret PER Scores
Understanding PER (Player Efficiency Rating) is crucial for evaluating a player's contribution on the court. Let’s break down what the different score ranges mean and how to interpret them in context.
What Low, Average, and High PER Scores Mean
PER scores are divided into ranges that reveal a player's impact:
- Below 10.0: This typically indicates a player who is struggling or has minimal impact on the game. These scores are often associated with bench players or veterans nearing the end of their careers.
- 10.0 to 15.0: This range covers below-average to average performance. Players here might be reliable role players, rookies still finding their footing, or older players whose performance has declined. A PER between 12.0 and 14.0 often describes dependable contributors who play their role effectively without significantly influencing the team’s overall success.
- 15.0 to 20.0: Players in this range are above average to very good. This includes solid starters, seasoned veterans, and rising stars. A PER of 17.0 to 19.0 typically belongs to players who are key members of the starting lineup.
- Above 20.0: These scores signal star-level performance. Players in this range are making a noticeable impact across multiple statistical categories. When a player crosses the 25.0 threshold, they’re delivering an MVP-caliber season, dominating in nearly every aspect of the game.
- Above 30.0: This represents an extraordinary season, the kind that happens only once or twice in a decade. These performances are remembered for their exceptional efficiency and are often considered historic.
Comparing PER Across Players, Positions, and Seasons
While the numbers themselves are important, context adds depth to understanding PER. Here’s how factors like position, playing time, and team dynamics influence interpretation:
- Position Matters: Different positions naturally produce different PER ranges. For example, centers often post higher PER scores due to their efficiency near the basket and rebounding numbers. In contrast, a point guard with an 18.0 PER might be having an outstanding season for their role, even if their score is lower than that of a center.
- Impact of Playing Time: A starter logging 35 minutes per game with a 22.0 PER faces different challenges than a bench player with the same rating in 20 minutes of play. Starters deal with tougher defensive schemes and must sustain their efficiency over longer stretches, while bench players may face less defensive pressure but have fewer opportunities to contribute.
- Team Style and Pace: Players on fast-paced, high-scoring teams often see inflated PER numbers compared to those on slower, defense-oriented teams. Although PER adjusts for pace mathematically, the overall playing style of a team can still influence a player’s efficiency.
- Seasonal Comparisons: PER is recalibrated to a league-average of 15.0 every season, making it possible to compare players across different years. However, changes in league trends - like the rise of three-point shooting - can subtly shift how efficiency is measured over time.
- Age and Experience: A 22-year-old with a 16.5 PER might be on the rise, while a 32-year-old with the same score could be showing signs of decline. Context like age and career trajectory is essential for projecting future performance.
How PER Is Calculated: Formula Breakdown
The Player Efficiency Rating (PER) formula blends a player's positive contributions with deductions for negative actions, then adjusts for playing time and game pace. This ensures fair comparisons across players, regardless of their roles or teams.
Positive and Negative Stats in PER
To understand PER, it helps to break down its core components. Players earn positive contributions through stats like points, assists, and rebounds. On the flip side, negative actions - such as missed shots and turnovers - reduce their efficiency.
Not all stats are weighted equally. For instance, assists carry more value than rebounds because they directly lead to scoring opportunities. Similarly, three-point shots are weighted higher than two-pointers due to their additional point value. Turnovers, however, have a significant negative impact since they immediately hand possession to the opposing team.
Here's an example: A player who shoots 25/25 can end up with a lower PER than one shooting 18/12. Why? The first player's missed shots hurt their efficiency, whereas the second player makes better use of their possessions, highlighting PER's emphasis on effectiveness over sheer volume.
Per-Minute and Pace Adjustments Explained
PER is calculated as a per-minute rating, allowing comparisons between players regardless of how much playing time they get. For instance, a bench player averaging 15 minutes per game can be fairly compared to a starter logging 35 minutes per night. The formula divides a player's total contributions (both positive and negative) by their minutes played.
To account for differences in team pace, PER also includes adjustments for how quickly a team plays. After these adjustments, the scores are standardized so the league average always equals 15.00. This not only allows comparisons across teams but also makes it possible to compare players from different eras as the game evolves.
Now, let’s see how PER measures up against other common basketball metrics.
PER vs Other Basketball Metrics
The table below highlights how PER compares to other metrics in terms of complexity, included stats, and best use cases:
| Metric | Calculation Complexity | Key Stats Included | Best Use Cases |
|---|---|---|---|
| PER | Highly complex with weighted stats and adjustments | All major box score stats, pace-adjusted | Comprehensive player evaluation, cross-era comparisons, spotting undervalued players |
| Efficiency (EFF) | Simple addition and subtraction | Points, rebounds, assists, steals, blocks, minus negatives | Quick player assessment, basic performance tracking, beginner-level analysis |
| Points Per Game | Simple average | Points only | Scoring comparisons, offensive impact evaluation |
Efficiency (EFF) uses a straightforward formula: positive stats minus negative stats. It’s easy to calculate manually, but it doesn’t account for differences in playing time, team pace, or the varying importance of different stats. A player who logs more minutes might appear more "efficient" simply because they have more opportunities to rack up stats.
PER, while more complex, paints a more accurate picture. By weighing stats based on their real impact and factoring in pace and playing time, it ensures fair comparisons. While EFF might suffice for casual analysis, PER is the go-to for deeper evaluations of player performance and value.
StatPro simplifies this process by automatically calculating PER and presenting it alongside simpler metrics. This gives you the flexibility to choose the right tool for your analysis, whether you're diving deep or just looking for a quick overview.
Using PER for Player Analysis
Leverage PER to gain deeper insights into player performance and efficiency.
Tracking Player Development Over Time
PER is a great tool for spotting career trends. Since it adjusts for pace and playing time, it provides a clear picture of a player's performance, no matter their role or team changes. For instance, an upward trend in a young player’s PER might show they’re adapting well to the NBA’s speed, while a gradual drop for a veteran could signal it’s time to rethink their role. With StatPro’s historical data, you can easily track these trends across multiple seasons to understand how players evolve.
Now, let’s see how PER helps differentiate performance across various roles.
Comparing Starters and Bench Players
Because PER works on a per-minute basis, it’s perfect for comparing players who have vastly different playing times. The pace adjustment ensures a level playing field for these comparisons. For example, if a bench player posts an above-average PER, it could highlight their efficiency and hint at their potential to take on a bigger role. However, context matters - bench players often face second-unit opponents, which might inflate their numbers, while starters are up against tougher competition. Identifying consistent patterns is key to spotting sustainable performance. StatPro’s game-by-game PER tracking tool makes it easier to analyze these trends and draw meaningful conclusions.
Evaluating Trades and Roster Changes
PER also shines when evaluating trades or tweaking rosters. Its standardized approach helps uncover how a player might perform in a new system. For example, a player struggling in a slower-paced lineup might thrive with improved numbers in a faster-paced system. Combining PER trends with contract details can also help assess salary efficiency and overall player value. When building a roster, comparing the efficiency of different lineups can reveal areas that need attention. With StatPro’s team analytics, you get the tools to make data-driven decisions for smarter roster construction.
Key Takeaways About Reading PER
Player Efficiency Rating (PER) simplifies a player's contributions into a single number while accounting for pace and playing time. With 15.0 as the league average, it's easy to gauge performance - scores above that mark indicate above-average efficiency, while anything below suggests there’s room to grow.
What makes PER particularly useful is its ability to adjust for per-minute contributions and game pace. This allows fair comparisons across players, whether you're analyzing a league superstar or a bench player with limited minutes. Typically, elite players achieve PER scores above 20.0, while All-Star-level performances usually range between 18.0–20.0.
However, context is key when interpreting these numbers. A high PER for a bench player might reflect favorable matchups, while a starter’s score could be influenced by tougher defensive responsibilities. For a clearer picture, it’s best to track trends over multiple games or seasons rather than focusing on isolated spikes or dips.
To get the most out of PER, pair it with other metrics and consider the broader context. Use it to spot rising stars, evaluate potential trades, or analyze how players adapt to new roles. Remember, while PER is excellent for measuring overall efficiency, it doesn’t fully capture defensive impact or team dynamics.
FAQs
How does Player Efficiency Rating (PER) account for different player positions and roles on a team?
Player Efficiency Rating (PER) is a metric that aims to capture a player’s overall impact by analyzing their contributions - both positive and negative - on a per-minute basis, while also adjusting for the game’s pace. It provides a standardized way to compare players, regardless of their playing style, by focusing on their statistical performance.
That said, context matters when interpreting PER. For instance, players in certain roles, like centers, often score higher due to their efficiency in areas such as rebounding and close-range scoring. Meanwhile, guards might shine in playmaking or long-range shooting, which may not always translate into a high PER. While PER is a useful tool, it’s most effective when combined with other metrics and a clear understanding of a player’s specific role within their team.
Does a high PER always mean a player is performing better, or are there other factors to consider?
Not exactly. While a high Player Efficiency Rating (PER) does spotlight a player's offensive strengths - like scoring, assists, and rebounds - it doesn’t paint the entire picture of their game. PER leans heavily on measurable stats, but it often overlooks critical factors like defensive prowess, leadership qualities, or those hard-to-quantify moments, like hustle plays, that can shift a game’s momentum.
To truly evaluate a player, you’ve got to look at the bigger picture. Consider their role on the team, the minutes they’re logging, and how their unique skills contribute to the team’s overall success. PER can be a helpful piece of the puzzle, but it works best when paired with other metrics and on-court observations for a more complete analysis.
How does Player Efficiency Rating (PER) account for different team playing styles, and why is this important?
Player Efficiency Rating (PER) takes the pace of play into account by adjusting for the number of possessions a team has in a game. This way, players on fast-paced teams - who naturally rack up more stats - aren’t unfairly measured against those on teams with slower tempos.
This adjustment levels the playing field, offering a fair way to evaluate performance. It allows fans and analysts to compare players accurately, no matter the differences in team styles or game speed.