Special Teams Analytics: Key Insights for Bettors
Analyze field-goal splits, net punting, kickoff/return efficiency and DVOA/EPA to spot special teams edges that can shift spreads, totals, props and live NFL bets.

Special teams play a critical role in NFL betting, influencing field position, scoring, and game outcomes. While most bettors focus on offense and defense, understanding special teams metrics like field goal accuracy, punting stats, and kickoff coverage can give you an edge. Here's what you need to know:
- Field Goals: Analyze success rates by distance (0–39, 40–49, 50+ yards) and situational performance (e.g., late-game accuracy).
- Punting: Net punting averages and punts inside the 20-yard line impact field position and scoring probabilities.
- Kickoffs and Returns: Metrics like touchback rates, return yardage, and starting field position reveal hidden yardage advantages.
- Betting Impact: Strong special teams can influence spreads, totals, and live betting opportunities.
Platforms like StatPro provide real-time special teams data, helping bettors track key stats and adjust strategies. By incorporating these insights into your analysis, you can make more informed decisions on spreads, totals, props, and live bets.
How Do Special Teams Stats Impact Team Performance?
Where to Find Special Teams Data
Special teams play doesn’t just shift field position - it can also open up betting opportunities if you know where to dig for the right stats. The problem? Most standard box scores barely scratch the surface, offering only basic kicking results without the deeper context you need to uncover betting angles. To get a real edge, you’ll want tools that bring together real-time stats on field goals, punting, kickoffs, and returns. Platforms like StatPro are designed to consolidate these numbers, making it easier to compare teams and find actionable insights.
Using StatPro for Special Teams Statistics
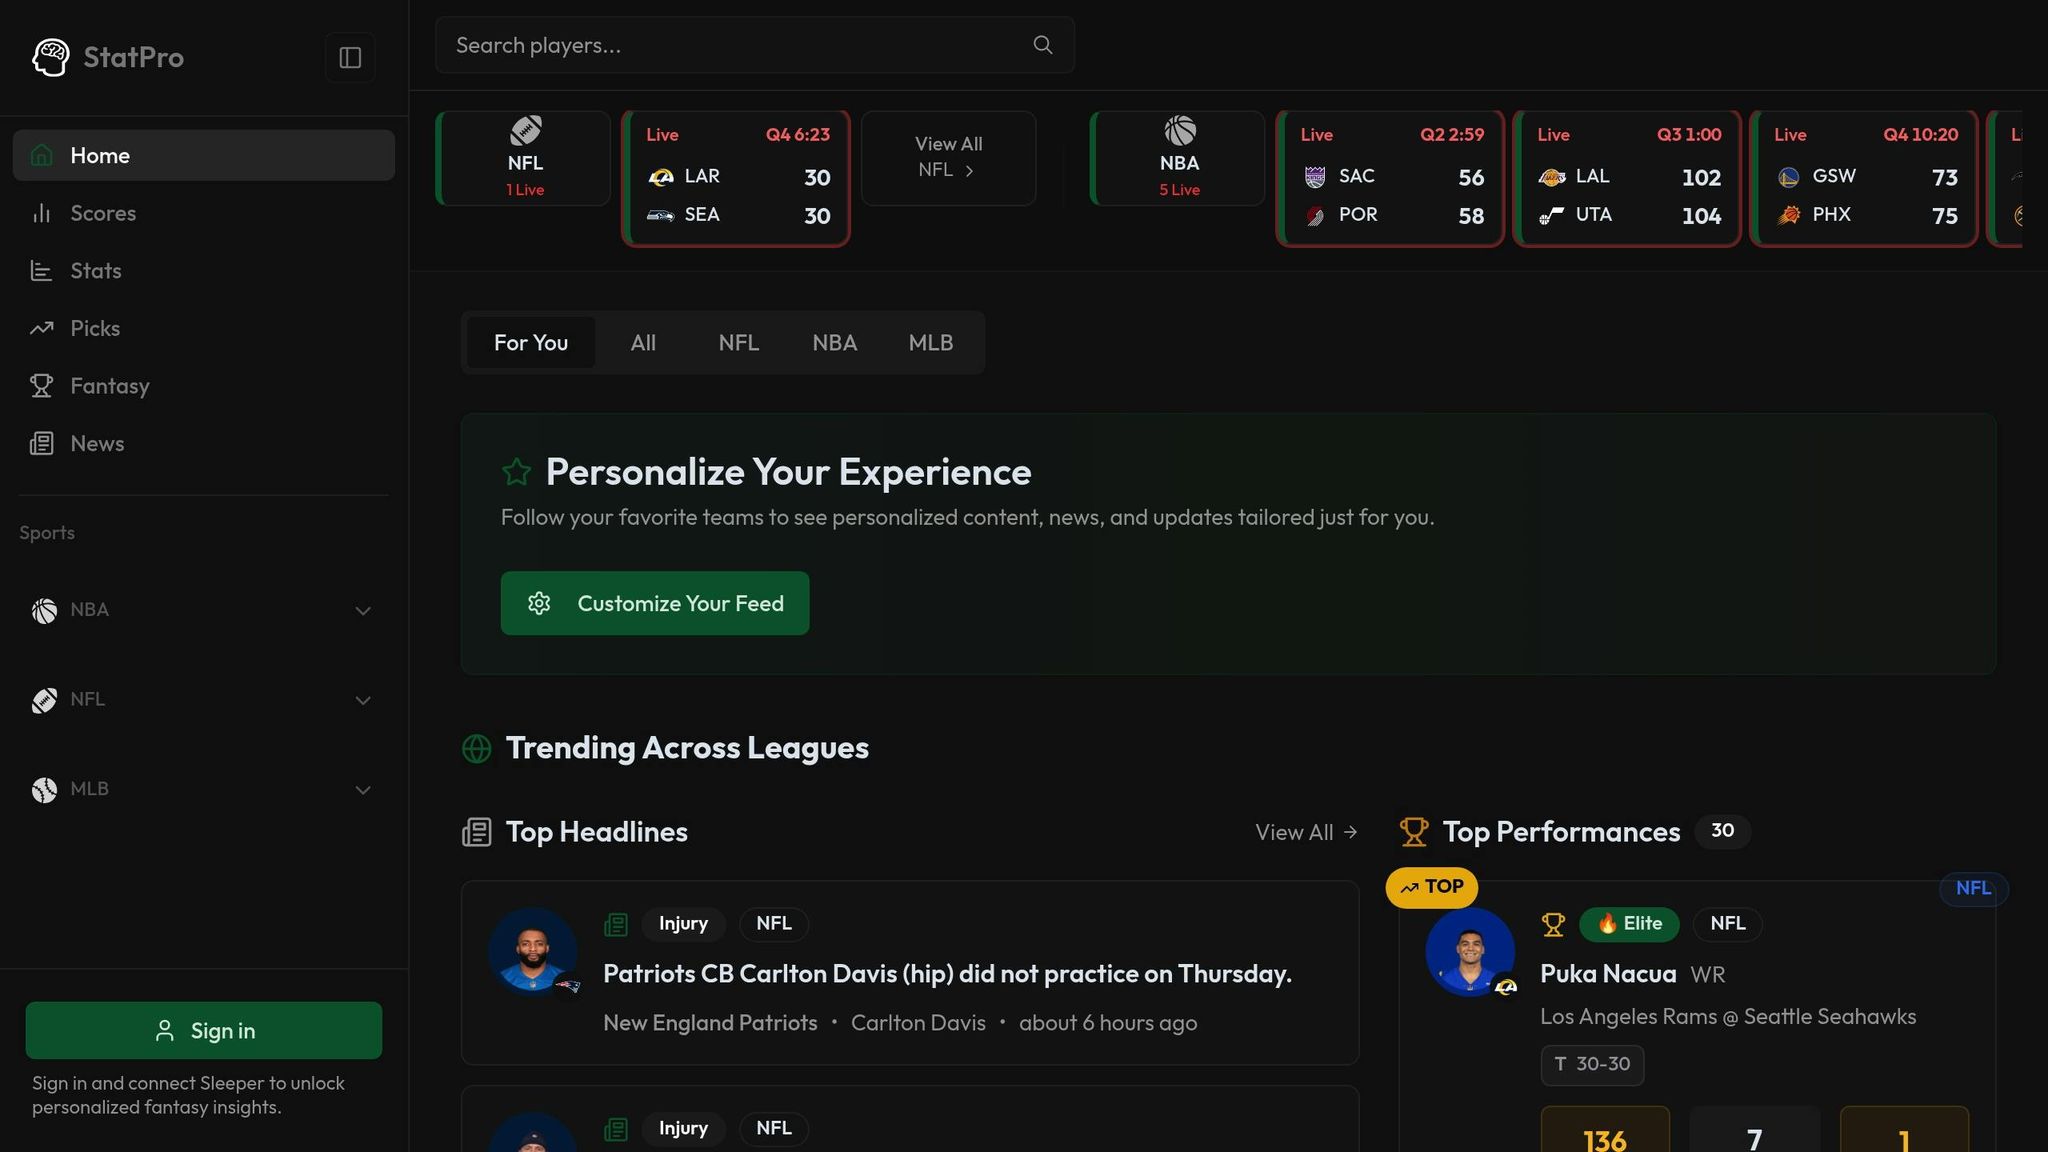
StatPro (https://statpro.io) is a go-to platform for NFL analytics, offering a treasure trove of special teams data updated in real time. In its Stats section, you’ll find sortable metrics like field goal percentages by distance, net punting averages, touchback rates, and return yardage. The data is organized into team and player profiles, which can be filtered by recent performance - especially useful during mid-season roster changes.
What really sets StatPro apart is its Injury and Transaction feeds. For instance, back in December 2025, the platform tracked critical updates like the Green Bay Packers placing running back MarShawn Lloyd on injured reserve and Kansas City Chiefs wide receiver Rashee Rice missing practice due to a concussion. These details are gold for bettors, as they directly affect return units and coverage teams. Plus, if you’re into fantasy football, you can sync platforms like Sleeper to uncover personalized insights, highlighting standout specialists for prop bets. This kind of information can be a game-changer when it comes to refining your betting strategy.
Core Special Teams Numbers to Track
When evaluating special teams, there are a few key metrics to keep an eye on. For field goals, focus on the overall success rate, splits by distance (especially from 40–49 yards and 50+ yards), extra point accuracy, and home-road splits. These numbers give you a clear picture of a kicker’s reliability under different conditions.
For punting, look at the net punting average, which factors in return yards and touchbacks. Pay attention to the percentage of punts pinned inside the 20-yard line and the touchback rate - these stats reveal how well a team manages field position battles.
When it comes to kickoffs and returns, track touchback percentages, the average opponent starting field position after kickoffs, and average return yardage for both kicks and punts. Explosive returns (30+ or 40+ yards) are another critical metric. Teams that consistently allow opponents to start past their own 27–30 yard line are giving away hidden yardage that can influence tight games against the spread. If you can access advanced stats like special teams DVOA, even better - it rolls overall efficiency into a single number, making it easier to compare teams and speed up your handicapping process.
Special Teams Metrics That Impact Betting
Once you’ve located reliable special teams data, the next step is figuring out which stats can actually influence your bets. Zeroing in on the right metrics can help you uncover betting angles that traditional analysis might miss. These refined stats can lead to sharper betting decisions, which we’ll explore in the sections below.
Field Goal Success Rates and Accuracy
A kicker’s overall field goal percentage only scratches the surface. For betting purposes, it’s more useful to break down performance into three distance ranges: 0–39 yards (typically high conversion rates), 40–49 yards (more variable), and 50+ yards (low and inconsistent). A kicker who excels inside 49 yards but struggles beyond that can lead to coaching decisions that directly impact spreads - especially around critical numbers like 3, 7, and 10. These decisions can also swing totals, as a single made or missed kick could be the difference between hitting the over or under.
It’s also smart to consider situational splits: How does a kicker perform in the fourth quarter or overtime? What about in one-score games, or under specific conditions like outdoor stadiums, wind, and cold weather? These factors become especially important late in the season, during December and January games. As noted by professional bettors at Action Network, a "complete mismatch in special teams may be the difference in making a play or passing." For example, if you’re leaning toward an under in a defensive battle with subpar kickers - especially from 40+ yards - missed field goals could reinforce your bet. These detailed splits are also valuable for live betting and prop markets.
Punting Stats and Field Position
Special teams metrics, particularly punting stats, play a major role in shaping scoring probabilities and betting strategies. The key stat to watch is net punting average, which measures the actual yardage impact of punts after factoring in returns. A punter with a strong net average and a high percentage of punts inside the 20-yard line can push opponents into poor field position, lowering their chances of scoring.
When betting totals, games featuring two strong punters and conservative offenses often point to value on the under. Starting drives deep in their own territory forces offenses to string together more plays to reach scoring range, increasing the chances of a drive stalling, ending in a turnover, or resulting in another punt. A solid net punting average reduces the expected points per drive, making it an important stat for bettors eyeing low-scoring matchups.
Kickoff Coverage and Return Performance
Kickoff stats provide insight into the "hidden yardage" that sets the stage for offensive drives. Key metrics include average starting field position after kickoffs, touchback percentage, and return yards per attempt. Teams with strong coverage units and high touchback rates force opponents to start closer to their own 25-yard line, which reduces scoring opportunities and supports under bets by limiting big-play variance.
On the flip side, teams with elite returners matched against weak coverage units can create short fields and quick scoring chances. A single long return can swing momentum and lead to immediate points, increasing volatility. For underdogs, strong return units can provide much-needed scoring opportunities even when the offense struggles. For favorites, reliable coverage units help minimize sudden shifts in field position.
Adding these metrics to your pre-bet checklist - especially for live betting - can help you predict scoring outcomes more effectively. A single big return can dramatically alter the game’s trajectory, so understanding these stats is crucial for anticipating how the game script might change.
How to Use Special Teams Data in Your Bets
Combining EPA and DVOA for Matchup Analysis
To make smarter bets, you can use special teams metrics to create a three-part team rating: offense, defense, and special teams. Start by using special teams EPA per play to understand how many points a unit contributes or costs during a game. Then, factor in special teams DVOA, which adjusts performance based on the strength of opponents and compares it to the league average. When two teams are evenly matched in offense and defense, a clear advantage in special teams - like a top-5 DVOA unit going up against a bottom-5 unit - can serve as the deciding factor for a spread or moneyline bet.
For spreads, calculate by subtracting defensive ratings from offensive ratings, adding 1.5–2.5 points for home-field advantage, and then adjusting by 0.5–1 point based on special teams impact. If this adjusted rating differs from the market by 1.5–2 points, especially near key numbers like 3 or 7, you might have found a value bet. For totals, consider pace and efficiency stats. Lean toward the under if both teams have strong punters and weaker long-range kickers, as this could lead to stalled drives and fewer field goals. On the flip side, favor the over when both teams have accurate kickers and explosive return units, as these factors can lead to shorter fields and more scoring opportunities.
Keep your special teams ratings updated weekly, using a rolling four-to-six-game window. This approach helps you capture current trends without overreacting to one-off performances. Also, pay close attention to injuries or depth-chart changes at key positions like kicker, punter, and returner. Even a backup stepping in can shift a team’s expected EPA, requiring you to tweak your analysis. These adjustments can also open up opportunities in prop bets and live betting, which we’ll dive into next.
Finding Value in Props and Live Betting
Special teams data can give you an edge in prop markets, where odds are often less refined than in spreads or totals. For example, when betting on total field goals made, focus on teams with accurate kickers, conservative red-zone offenses, and coaches who prefer kicking on fourth downs. Teams with positive special teams EPA in the kicking game and strong punters who set up good field position often see more field goal attempts and makes. For longest field goal props, look for kickers with a proven ability to hit from 50+ yards, coaches willing to attempt long kicks, and favorable conditions like indoor stadiums or high-altitude venues. When both teams have reliable long-range kickers and a low touchdown expectation, overs on field-goal props can be especially appealing.
Live betting is another area where special teams performance can offer an advantage. Watch for real-time trends like punters consistently pinning opponents deep or coverage units allowing big returns. If a team’s punter is repeatedly setting up short fields or their return game is breaking off big plays, it may justify betting on that team or taking the over on the total. On the other hand, if a usually dependable kicker is struggling or if a team is avoiding field goals due to wind or injury concerns, this could support a live under bet, as their scoring potential might be lower than pregame expectations.
Tools like StatPro can help you stay on top of live stats and scoring updates, allowing you to react quickly before the market adjusts to these shifts.
Comparing Teams with Special Teams Tables
Special Teams Metrics Comparison Chart for NFL Betting Analysis
Building Team Comparison Charts
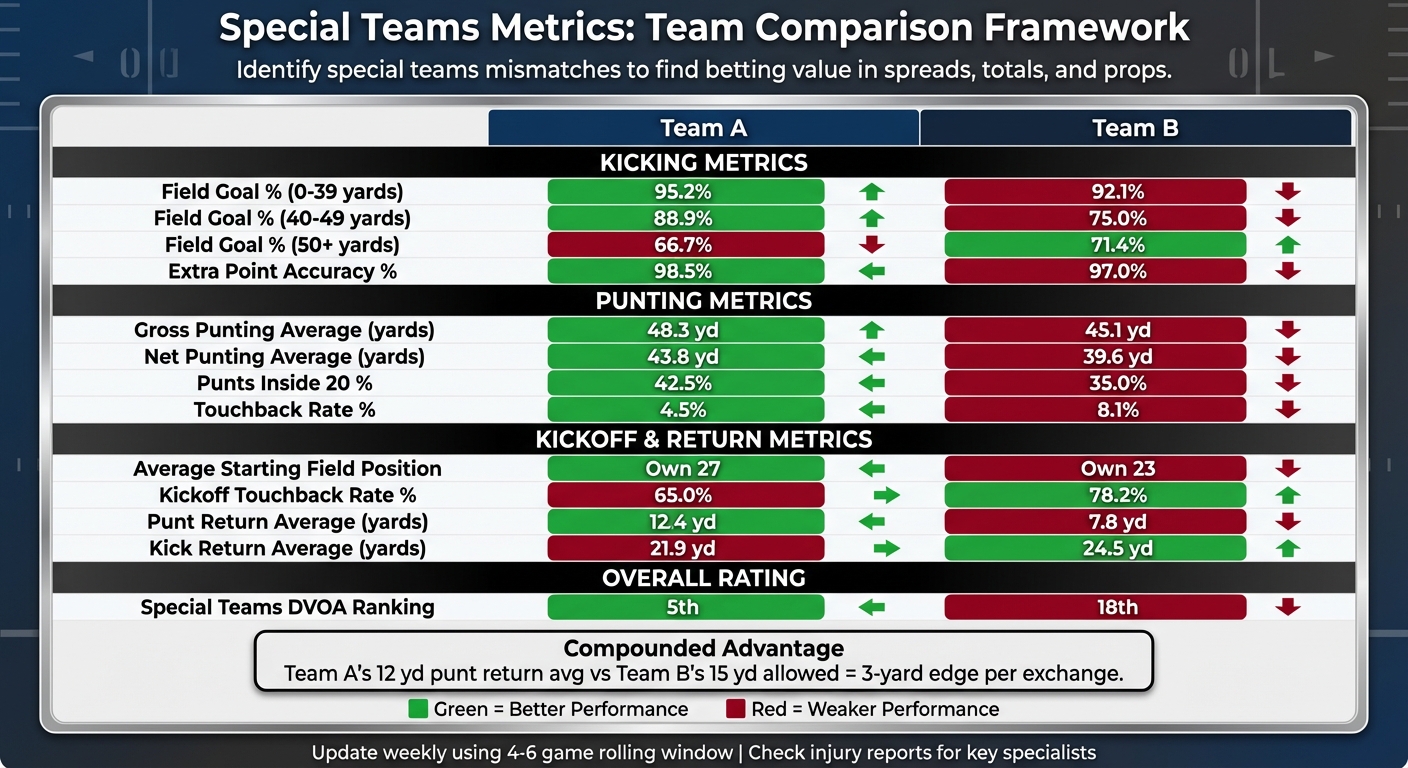
Crafting a detailed comparison table is an effective way to analyze two opponents side-by-side, helping you quickly identify where one team has an edge. Focus on key metrics like field goal percentages by distance, extra point accuracy, gross and net punting averages, punts inside the 20 versus touchbacks, average starting field position, kickoff touchback rates, return yardage, and an overall special teams rating (like DVOA). These stats reveal how reliable a team's kicker is, how well its punter can flip field position, and the hidden yardage created by return and coverage units.
Once you’ve decided on the metrics, organize them into a clear, easy-to-read format. Set up a table with each team in its own column and each metric in its own row. To make comparisons more intuitive, use color coding - highlight better values in green and weaker ones in red. For example, if Team A converts 90% of field goals from 40–49 yards while Team B manages only 75%, it’s clear Team A has the edge in clutch situations. Similarly, if Team B’s net punting average is 43 yards compared to Team A’s 41 yards, Team B may have a slight advantage in managing field position. Including a summary row with each team’s overall special teams rating or composite score can help emphasize mismatches, such as a top-5 team against a bottom-5 team.
When analyzing the table, pay attention to compounded advantages. Compare return averages against the opposing team’s coverage rates for both punts and kickoffs. For instance, if Team A averages 12 yards per punt return but Team B allows 15 yards on average, the 3-yard difference per exchange could add up over the course of a game, potentially setting up an extra scoring opportunity. These small but meaningful differences can influence totals and point spreads.
Your comparison table can also serve as a tiebreaker in closely matched games. When both teams have strong offenses and defenses that cancel each other out, special teams can become the deciding factor. A clear advantage - like a top-5 special teams rating against a bottom-5 rating - might tilt the scales for a spread or moneyline bet. For totals, consider the under when both teams have elite punters and below-average kickers, as this setup limits scoring opportunities. On the other hand, the over may be worth exploring when both teams feature accurate kickers paired with weaker coverage units, as these conditions often lead to more scoring chances.
Tools like StatPro make this process even easier by aggregating team rankings, player stats, and real-time NFL data. You can export detailed metrics like field goal splits, punting stats, and return/coverage numbers directly into your table. To keep your analysis relevant, update your tables weekly using data from the last four to six games. This approach balances current trends without overreacting to one-off performances. And don’t forget to check injury reports - losing a key kicker, punter, or returner can dramatically shift the balance and create new betting opportunities. Regular updates to your tables ensure your strategy stays sharp and adapts to changes in team performance over time.
Conclusion: Using Special Teams Data to Win More Bets
Key Takeaways for Bettors
Tracking metrics like field goal splits, net punting averages, and advanced ratings such as DVOA and EPA can give you a real advantage. Field position changes from punts, missed field goals around critical numbers like 3 and 7, and explosive returns can directly impact spreads and totals. By analyzing field goal percentages by distance, net punting averages, and return/coverage efficiency alongside special teams DVOA and EPA, you can price games more accurately, especially in matchups where offense and defense seem evenly balanced.
Make special teams analysis a regular part of your betting routine. Evaluate each team's kicker, punter, and coverage/return units and adjust your projected spread or total by 0.5–1 point when you identify mismatches. Experts often emphasize that factoring in special teams can be the deciding factor in whether to place a bet, particularly in tight matchups where coaching and attention to detail play a significant role. Tools like StatPro simplify this process by consolidating field goal splits, punting stats, and team rankings, saving you the hassle of gathering data from multiple sources.
Use these insights across spreads, totals, props, and live betting. For example, when elite punters face poor kickers, it often favors unders, while games with weak coverage units might lean toward overs. Props like return yardage or a team scoring a non-offensive touchdown become attractive when analytics highlight dangerous returners against weak coverage. In live betting, early special teams performance - like shanked punts or consistent big returns - can signal opportunities to adjust your in-game positions. This tailored approach helps you stay disciplined and make informed decisions.
Pair your analytics with a solid staking strategy. Whether using flat units or a conservative Kelly fraction, stay disciplined and pass on games where the special teams edge isn’t enough to beat the market line. Keep a log of outcomes to fine-tune your ratings over the season, avoiding overreactions to isolated plays. By treating special teams as an integral part of your matchup analysis - equal to offense and defense - you’ll uncover value that many overlook, giving you a sharper edge in every wager.
FAQs
How do special teams analytics improve my NFL betting strategy?
Special teams analytics can provide a powerful edge when it comes to NFL betting. By diving into metrics like field goal accuracy, punt efficiency, and kick return success, you can pinpoint teams that shine in these often underappreciated aspects of the game.
These insights can be a game-changer, helping you identify teams that may be undervalued by the market. This is especially useful for matchups where special teams play a pivotal role in shaping the final outcome. Using detailed analytics allows you to make informed, data-backed bets instead of relying on gut feelings or guesswork.
What are the most important special teams stats to consider for smarter betting?
When placing smarter bets, keeping an eye on critical special teams stats can make a big difference. Pay attention to metrics like field goal success rate, average punt distance, punt return yards, kickoff return yards, special teams penalties, and successful onside kick percentages.
These stats shed light on a team's performance in crucial areas, offering a clearer picture of their overall efficiency and helping you better anticipate game outcomes.
How can StatPro assist bettors with special teams analytics?
StatPro delivers in-depth insights into special teams performance, covering key areas like field goals, punts, and kick returns. By providing real-time stats and player performance data, it equips bettors with the tools they need to make informed, data-backed decisions.
With its detailed analytics, StatPro helps you spot trends and patterns in special teams play. This added layer of information can give you a sharper perspective when assessing game outcomes or targeting specific betting opportunities.