How to Spot Value Bets Using Player Performance Data
Learn how to identify value bets by analyzing player performance data, advanced statistics, and situational factors for long-term betting success.

Value betting is about finding odds where bookmakers underestimate the true probability of an outcome. By leveraging player performance data, you can identify these opportunities and maximize long-term profits. For example, if a team’s odds suggest a 33.3% chance of winning but your analysis shows a 40% chance, this creates a profitable edge over time.
Key takeaways:
- Advanced stats matter: Metrics like Player Efficiency Rating (PER), True Shooting Percentage (TS%), and Weighted On-Base Average (wOBA) reveal insights beyond basic stats.
- Situational factors count: Home/away splits, rest days, injuries, and weather conditions can impact performance and betting lines.
- Use tools like StatPro: Platforms offering real-time data and historical trends simplify identifying mispriced odds.
Player Performance Metrics That Matter
Advanced Statistics to Track
Box score stats like points, rebounds, and assists only scratch the surface. To truly evaluate betting opportunities, you need to dig into efficiency and context-based metrics. Take Player Efficiency Rating (PER), for example. This stat balances a player's positive contributions against their negative ones. A PER of 15 is considered average, while anything over 20 signals elite-level play. If a player's recent PER is significantly higher than their season average, it could point to an undervalued betting opportunity.
Another key metric is True Shooting Percentage (TS%), which goes beyond the basic field goal percentage by factoring in free throws and three-pointers. This gives a clearer picture of scoring efficiency. In the NBA, players with a TS% above 58% are considered highly efficient scorers. If you're analyzing player prop bets - like points or made shots - TS% is essential for spotting players whose efficiency might not be reflected in the betting odds.
For basketball, Effective Field Goal Percentage (eFG%) is another must-know stat. It adjusts for the extra value of three-pointers, offering a more accurate measure of shooting efficiency. For instance, a player shooting 45% from the field might seem average, but if their eFG% is 55% thanks to a high volume of three-pointers, they’re actually quite efficient. On the other hand, usage rate reveals how much of a team's possessions involve a particular player when they’re on the court. Players with high usage rates (above 25%) often have inflated betting lines, while efficient, low-usage players can present hidden value.
In baseball, Weighted On-Base Average (wOBA) is a go-to metric for evaluating offensive performance. A league-average wOBA sits around .320, while anything above .370 indicates top-tier performance. For pitchers, Fielding Independent Pitching (FIP) is invaluable. It focuses on outcomes directly under a pitcher’s control - like strikeouts, walks, and home runs - making it a better predictor of future performance than traditional ERA.
For football, Expected Points Added (EPA) per play is a standout metric. It measures how much each play contributes to a team’s expected point total. Quarterbacks with consistently positive EPA tend to outperform betting odds. Meanwhile, stats like pressure rate for pass rushers and target share for receivers provide deeper insights beyond raw sack or reception numbers.
While these advanced stats are essential, they become even more powerful when paired with situational analysis.
Situational Factors to Consider
Advanced metrics are only part of the story. To uncover real betting value, you also need to factor in situational elements. For instance, home/away splits can reveal performance differences that odds might overlook. Some players thrive on their home court, while others struggle with the pressures of playing away. A basketball player averaging 18 points at home but just 14 on the road could have betting implications when lines don’t fully account for venue.
Rest advantages also play a massive role, especially in the NBA. Back-to-back games often lead to fatigue, affecting shooting percentages and turnover rates. Conversely, players coming off three or more days of rest tend to perform better. Teams playing their fourth game in six nights often see a drop in efficiency across key stats.
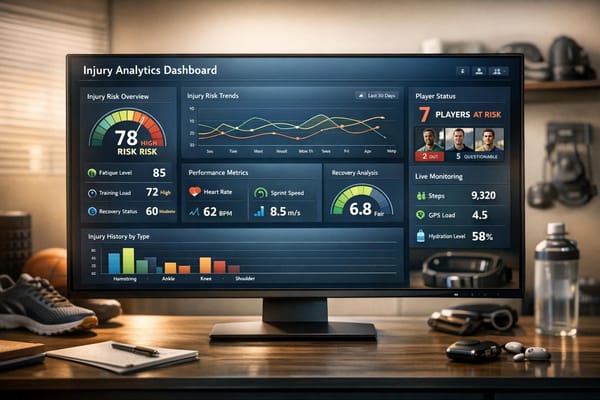
Injury history and load management are another critical factor. A player returning from a minor injury might have limited minutes or a reduced role, which can make under bets appealing. On the flip side, injuries to key teammates can push certain players into expanded roles, leading them to exceed their regular statistical projections.
In the NFL, weather conditions can dramatically alter game dynamics. Strong winds (over 15 mph) can reduce field goal accuracy and passing efficiency, while freezing temperatures (below 32°F) often favor running plays over passing. These elements can create value opportunities when betting lines don’t fully adjust for the conditions.
Finally, lineup changes and rotations can provide an edge across all sports. In the NBA, players moving into starting roles typically see a spike in usage. In baseball, hitters moving up in the batting order get more plate appearances, while in football, skill players benefit from increased target shares when teammates are sidelined.
How StatPro Provides These Metrics

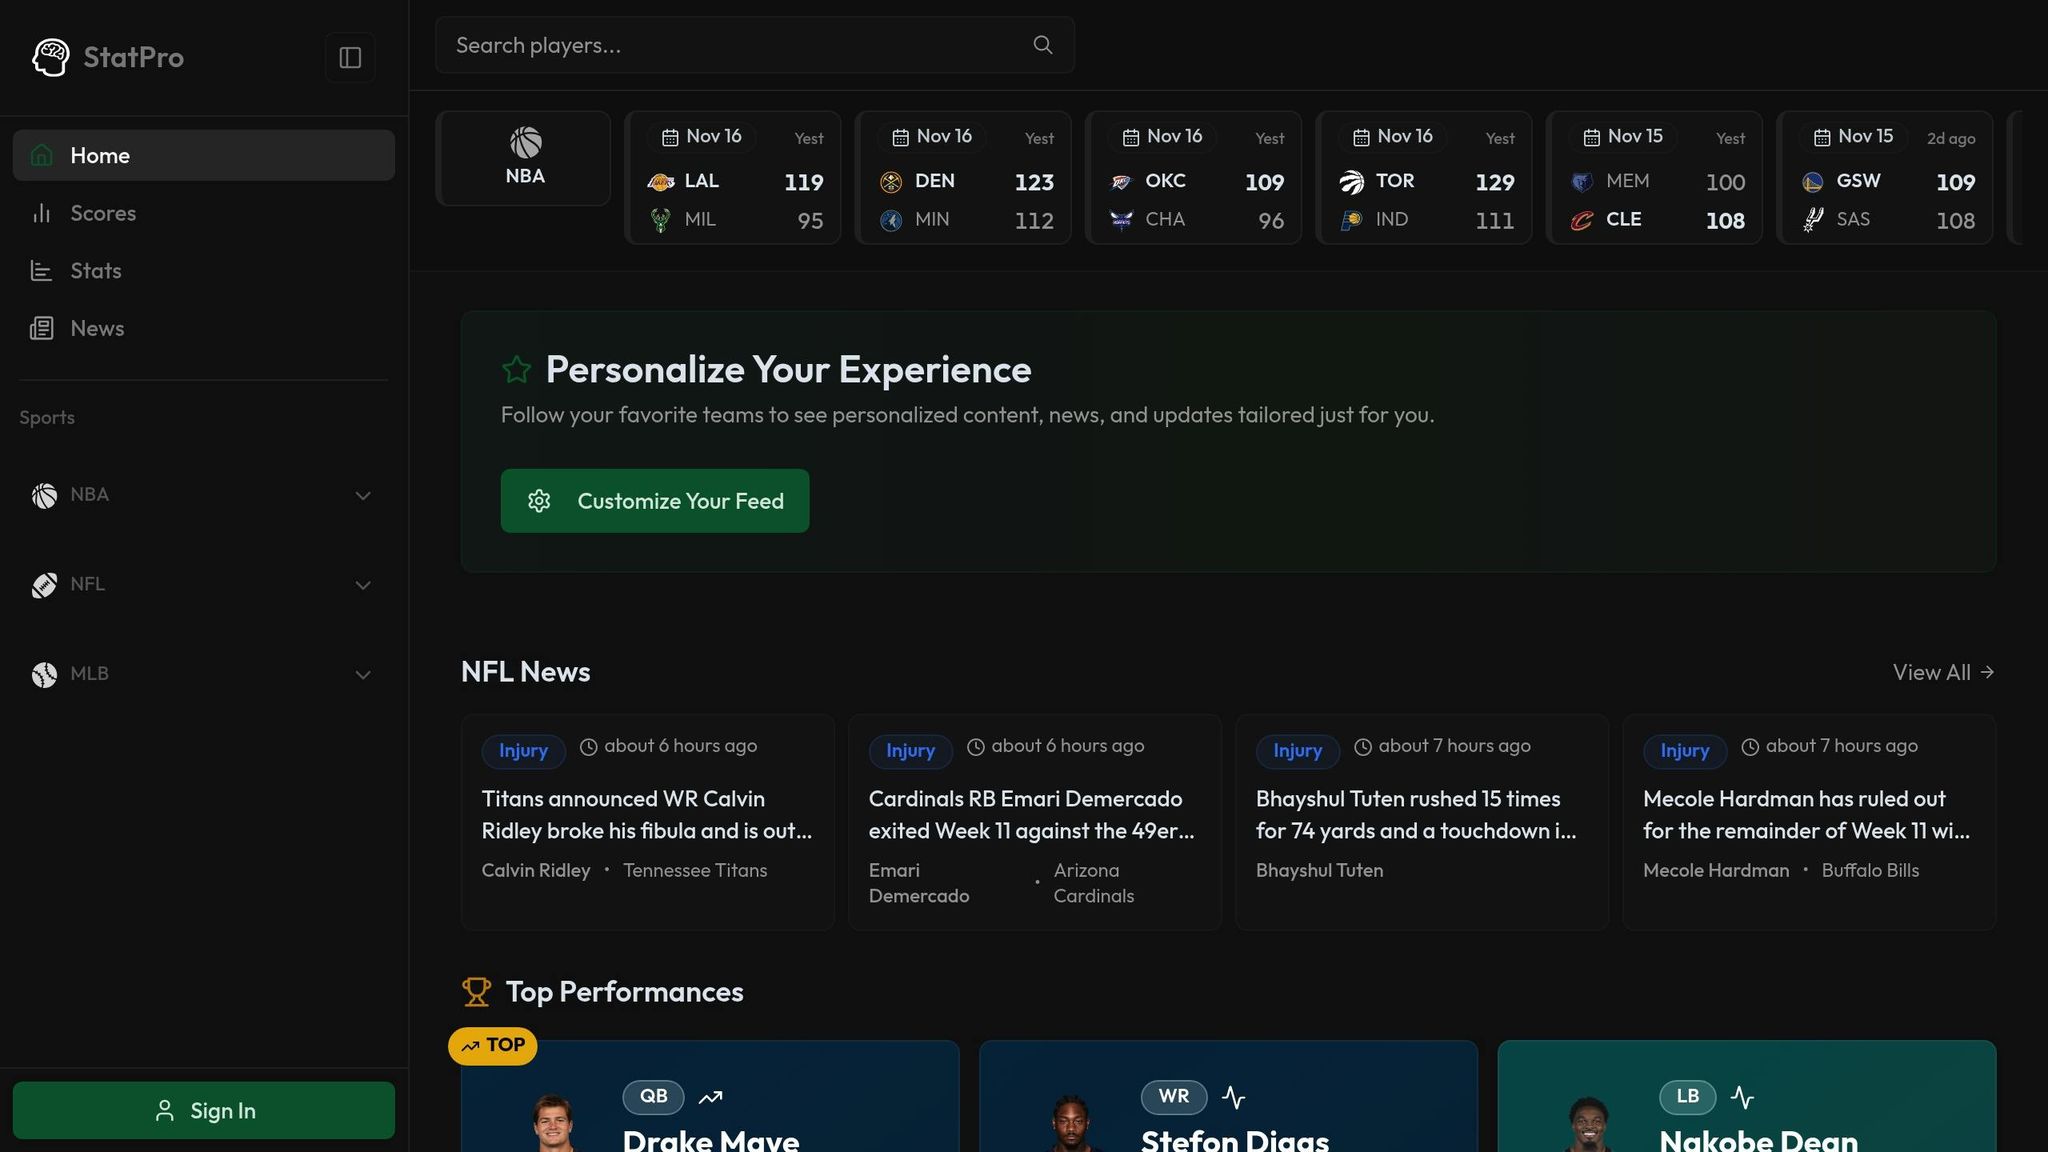
Spotting mispriced odds requires integrating all these metrics into one place, and that’s where StatPro comes in. With its real-time analytics dashboard, StatPro consolidates advanced stats into an easy-to-use format. For NBA players, it tracks PER, TS%, and usage rates, updating live during games. In baseball, it offers wOBA and FIP data with historical trends, while NFL metrics like EPA per play and pressure rates are updated weekly with detailed breakdowns.
The Pro plan, priced at $9.99 per month, offers tools that go well beyond basic box scores. You can filter player stats by home/away splits, rest days, and opponent strength. It also includes an injury tracking system that provides real-time updates and historical data on how injuries have impacted player performance in the past.
StatPro’s charting tools are another highlight, allowing users to visualize performance trends over specific timeframes. This makes it easier to identify when a player’s recent form deviates from their season-long averages. For those looking to take their analysis further, advanced plans include API access and custom reporting features, streamlining the research process for serious bettors.
Finding Trends and Patterns
Tracking Recent Player Form
Season averages can sometimes mask recent performance surges. To get a clearer picture, try using a 7-day rolling average. For instance, if a basketball player's recent scoring surpasses their season average, it could signal a potential value opportunity. This method isn't just for scoring - it works just as well for other stats like assists, rebounds, or even baseball metrics like batting average over a set number of games.
Streak analysis is another useful tool. If a quarterback consistently outperforms expectations over several games, it might indicate that betting lines haven’t caught up with their current form. By examining game-by-game performance, you can separate consistent trends from random volatility and spot where betting lines may lag behind reality.
Also, keep an eye on role changes. Players stepping up due to injuries or tactical shifts often see a boost in output before betting lines adjust to reflect their new level of involvement.
Team Dynamics and Matchup Analysis
While individual performance trends are important, understanding team dynamics and matchups adds another layer of insight. A player's stats often make more sense when viewed in the context of their team's playing style and the opponents they face. For example, a team with a faster pace of play generates more possessions per game, giving players more chances to rack up stats. This can make betting on higher totals appealing, even for players with average season numbers.
Defensive matchups are equally crucial. Some players struggle against teams with strong defensive metrics but thrive against opponents with weaker defensive strategies. Delving into how teams defend specific positions can reveal trends that season averages might overlook.
Travel and scheduling can also impact performance. Extended road trips or tight travel schedules often lead to lower efficiency and more turnovers. Venue-specific factors - like arena characteristics, crowd atmosphere, or even weather conditions in baseball - can influence outcomes as well. Historical matchup data also holds value, as certain players consistently perform better or worse against specific opponents, uncovering opportunities for value bets.
Using StatPro's Charts and Graphs
Once you've identified player and team trends, visual tools can make analyzing the data much easier. StatPro offers customizable dashboards that transform raw stats into clear, actionable insights. These tools let you track player performance trends across different timeframes, helping you spot both short-term streaks and longer-term patterns.
StatPro also enables you to compare player stats across various matchups and conditions. By filtering data based on factors like game location, rest days, or specific situational contexts, you can uncover opportunities where recent performance trends haven’t yet been factored into the betting lines.
The platform’s intuitive graphs make it easy to see which players are trending up or down across multiple statistical categories. Customizable notifications for significant performance changes ensure you stay ahead of emerging trends without constantly monitoring the data manually.
Additionally, StatPro highlights how changes in team dynamics - such as lineup adjustments or injuries - affect individual performance. This comprehensive view helps you identify value betting opportunities that might otherwise go unnoticed.
Creating Predictive Models
Basic Model Building Steps
Predictive modeling takes the insights and metrics you've gathered and turns them into a tool for spotting value bets with precision. The process begins with careful data preparation. Clean your dataset by removing incomplete games, unusual events, or inconsistent timeframes. For example, if you're modeling NBA player scoring, exclude games where a player saw limited minutes due to injury or blowouts - these outliers don't reflect typical performance patterns.
Next, focus on selecting variables that directly relate to your target. For instance, when evaluating NFL running backs, consider factors like the opponent's run defense, current weather conditions, and the player's recent workload. Start with the most relevant metrics and gradually introduce additional ones to refine your model.
Linear regression is a great starting point because it provides clear insights into how different variables impact your target. For more advanced scenarios, techniques like random forests can capture complex interactions. For example, a quarterback's completion percentage might depend on a mix of defensive strategies and weather conditions, which a random forest model can untangle effectively.
Before you place any bets, backtesting is essential. Use historical data to see how your model would have performed in the past. This step helps you gauge whether your model's accuracy is strong enough to overcome sportsbook margins. A good model balances statistical precision with situational awareness.
Combining Different Data Types
The most effective predictive models blend raw stats with situational context to paint a fuller picture of performance. Rest and travel schedules, for instance, can significantly impact outcomes. Players in back-to-back games often show reduced efficiency, while teams dealing with extended road trips might struggle defensively. Including these elements in your model can help you spot when star players may underperform compared to their usual averages.
Venue-specific factors also deserve attention. Variables like altitude, field dimensions, and crowd energy can influence game pace and individual performance. Adjusting for these environmental factors ensures your projections account for the nuances of different settings.
Comparing Your Projections to Betting Lines
Once your model is fine-tuned with diverse data, the next step is to compare its projections to market odds. Start by calculating the implied probabilities from betting lines and stack them against your model's predictions. For example, if your model indicates a player's scoring output is significantly higher than the sportsbook's line, you might have found a potential betting edge.
Look for odds where your model's projections stand out. Keep an eye on line movements as well. If your model supports one outcome but the line shifts in the opposite direction, it could signal new developments, like player injuries or tactical changes, that need to be factored in.
Confidence intervals are a helpful tool for determining bet sizes. If your model projects outcomes close to the betting line, it might be best to wager conservatively. On the other hand, a large gap between your projection and the posted line - especially when supported by multiple factors - could justify a more aggressive bet.
Track closing line values to evaluate your model's performance over time. If you notice that lines frequently move in your favor before game time, it’s a strong sign that your model is uncovering genuine opportunities. Tools like StatPro's historical line tracking can help you analyze these trends and refine your strategy.
Tracking Your Betting Results
Calculating ROI and Win Rates
Once you've built your predictive models, the next step is tracking your results to ensure long-term success. Start by calculating your ROI (Return on Investment). The formula is simple: divide your net profit by the total amount wagered, then multiply by 100. For instance, if you bet $1,000 in a month and earned $150 in profit, your ROI would be 15%.
However, don't let a high win rate fool you - it can be misleading if your bets are placed at low odds. The real measure of success lies in your net units won. For example, someone winning 60% of their bets might still lose money if they consistently wager on low-odds bets. On the other hand, a bettor winning just 45% of wagers at +120 odds could outperform someone with a 55% win rate at -140 odds.
Another key metric to watch is closing line value (CLV). This measures whether the betting line moves in your favor before the game starts. A consistent positive CLV - even just 1-2% - can indicate that your picks are sharp and well-researched. Keeping detailed records of your bets can help reveal trends and patterns in your performance.
Using StatPro to Analyze Sports Performance Data
StatPro's Pro plan, priced at $9.99/month, offers a powerful toolkit for analyzing sports performance data. With access to detailed player stats and team rankings, you can compare game outcomes to your pre-game predictions. Real-time scores and in-depth game insights also help you monitor developments as they happen, giving you a clearer picture of which metrics are most predictive.
StatPro doesn’t just stop at live updates. It provides essential context through resources like injury reports and transaction news, helping you understand unexpected outcomes. Covering major leagues like the NFL, NBA, and MLB, the platform offers a broad perspective on the factors that can sway game results. Plus, its historical data allows you to dive into seasonal trends - like how player roles shift after key breaks or how weather impacts gameplay - helping you sharpen your analytical models.
These tools and insights are invaluable for refining your approach over time.
Improving Your Models Over Time
Tracking your results isn’t just about measuring success - it’s also about improving your models. Regularly review your outcomes, ideally on a monthly basis, to identify trends and weaknesses. For example, your model might consistently overrate certain player types or overlook critical matchup dynamics. As teams tweak strategies or players’ roles evolve, consider recalibrating your model every few months.
When experimenting with new variables, make changes gradually. Instead of overhauling your entire system, introduce one new factor at a time - like opponent pace or situational dynamics - and observe its impact over a meaningful sample size. Document both successful and unsuccessful tweaks, as even minor improvements in accuracy can add up over hundreds of bets. Over time, these adjustments will help you make more precise and informed decisions.
Summary and Next Steps
Key Value Betting Strategies
Effective value betting revolves around three primary strategies: tracking advanced player metrics, analyzing recent trends and matchups, and building predictive models. The focus isn’t on chasing big wins but on finding consistent, small advantages. Even a modest edge of 2-3% over the sportsbook's line can lead to meaningful profits when spread across hundreds of wagers in a season.
These strategies become even more impactful when paired with the right tools.
How StatPro Simplifies the Process
StatPro’s Pro plan, priced at $9.99/month, brings everything you need into one streamlined dashboard. From player stats and team rankings to injury updates, it covers NFL, NBA, and MLB. The platform also offers real-time scores and game insights, allowing you to track your predictions as games progress. Plus, its historical data feature lets you backtest your models and uncover seasonal trends.
One standout feature is the injury updates and transaction news, which can help you identify opportunities before betting lines adjust to roster changes. Additionally, StatPro’s detailed player stats and team rankings provide the foundation for building predictive models, giving you the tools needed to uncover those small but profitable edges.
With these resources at your fingertips, you’re well-equipped to apply the strategies outlined in this guide.
Getting Started
To kick off your value betting journey, use StatPro’s data-driven insights and start with a single league - NFL, NBA, or MLB - based on where you feel most knowledgeable. Focus on mastering the league’s key metrics and use the platform’s historical data to create a simple predictive model for a specific bet type, such as player prop bets or team totals. Once you’ve refined your approach, you can expand into other markets.
Keep a record of your bets, along with the data and reasoning behind each one, to improve your model over time. Building a profitable betting strategy takes patience, so expect to spend a few months fine-tuning your process before achieving consistent results.
Finally, start small. Use modest wagers while you’re learning, as even the best strategies need time to prove their worth. Managing your bankroll wisely during this phase is crucial to long-term success.
Process to Build a Sports Betting Model End to End
FAQs
How can I use player performance data to find value bets in sports like the NFL, NBA, and MLB?
To pinpoint value bets using player performance data, dive into advanced player statistics, recent performance trends, and predictive modeling. These tools can help you spot situations where betting odds don’t align with a player’s or team’s actual potential.
Take into account details like a player’s current form, injury history, or how they perform against specific opponents. When you pair these observations with data-driven models, you can uncover overlooked betting opportunities in major sports like the NFL, NBA, and MLB. Begin with smaller bets, fine-tune your strategies, and adjust as you gain experience and confidence.
What situational factors can affect betting lines, and how do I include them in my analysis?
Situational factors can dramatically affect betting lines. Things like player injuries, changes in team chemistry, coaching adjustments, travel demands, or even external distractions can all play a role in shaping how teams and players perform. These shifts often present chances to find bets with better value.
To navigate these variables effectively, dive into recent player performance trends. Look at stats from the past 5, 10, or 20 games to spot patterns or unusual shifts tied to these situational changes. This approach can help uncover where the odds might not align with the current state of play.
How does StatPro simplify finding value bets and tracking your betting performance?
StatPro simplifies the process of spotting value bets by analyzing player performance data and identifying odds that might be off the mark. Using a mix of advanced stats, recent trends, and predictive modeling, it reveals opportunities you might not catch on your own.
On top of that, StatPro lets you track your betting performance with ease. Its tools help you monitor your bets, returns, and overall profitability, giving you the insights needed to fine-tune your strategies. It’s an all-in-one tool for discovering and managing bets efficiently.


