How Streaming Analytics Predicts Game Outcomes
How live data, player tracking, and low-latency pipelines power real-time win probabilities, player metrics, and tactical insights during games.

Streaming analytics is transforming how we watch and analyze sports by delivering real-time predictions and insights during games. Unlike traditional methods that process data after the fact, streaming systems analyze live data - like player movements, scores, and contextual factors such as weather - within milliseconds. This allows for dynamic win probabilities, updated player stats, and tactical insights as the game unfolds.
Key takeaways:
- What it does: Processes live game data to predict outcomes, update stats, and provide insights in real time.
- Who benefits: Coaches, bettors, broadcasters, and fans use these predictions for decision-making, betting odds, and enhanced viewing experiences.
- How it works: Combines live play-by-play data, player tracking, and contextual information using advanced models and low-latency pipelines.
- Accuracy: Advanced models achieve up to 74% accuracy in predicting game outcomes.
From smarter coaching decisions to engaging fan experiences, streaming analytics is reshaping sports by turning raw data into actionable insights instantly.
Data and Analytics in Live Sport Broadcast
Understanding the Prediction Problem
To build a streaming analytics system that predicts game outcomes, you first need to pinpoint what you want to predict and when. Start by asking focused questions like, "Who is likely to win now?" and turn those into measurable targets. The success of your prediction system depends heavily on how well you define the problem upfront. Once you’ve nailed that down, establish specific metrics to guide the training of your models.
Setting Your Prediction Goals
Your first step is to determine the target: Are you predicting game-level outcomes (like win probability or final score), event-level outcomes (such as scoring chances per drive or possession), or player-level metrics (like yards, points, or rebounds)? Each target requires its own data, models, and evaluation methods. For instance, win probability is typically a binary classification problem - predicting whether Team A wins or loses - expressed as a percentage between 0% and 100%. On the other hand, predicting a final score is a regression problem, producing a continuous number within the usual scoring range for that sport. Research shared at the MIT Sloan Sports Analytics Conference demonstrated that when prediction targets are clearly defined and aligned with the right modeling techniques, advanced models can achieve up to 74% accuracy in forecasting game outcomes.
It’s also critical to define when predictions will be made. Pre-game predictions rely on historical data, while in-game predictions dynamically adjust using live data like score, time remaining, and possession. A robust streaming analytics system updates predictions in real time - after every football play, basketball possession, or baseball pitch - transforming a static pre-game forecast into a dynamic probability curve that evolves as the game unfolds.
Common Use Cases for Game Predictions
After defining your targets, the next step is understanding who will use these predictions and how. Different stakeholders have different needs:
- Coaches and analysts require decision-support tools that adjust win probabilities based on in-game decisions. These predictions must be highly detailed and tied to specific scenarios.
- Sportsbooks and live betting operators need accurate, low-latency probabilities for betting markets. These models must not only be precise but also well-calibrated across thousands of events, as financial stakes depend on their reliability.
- Broadcasters and media companies use predictions to enrich the viewing experience. Tools like live win probability graphs, expected goals (xG), and momentum indicators help commentators break down the significance of key plays, such as a critical three-pointer or a turnover. These outputs must be simple, visually engaging, and easy for casual viewers to grasp.
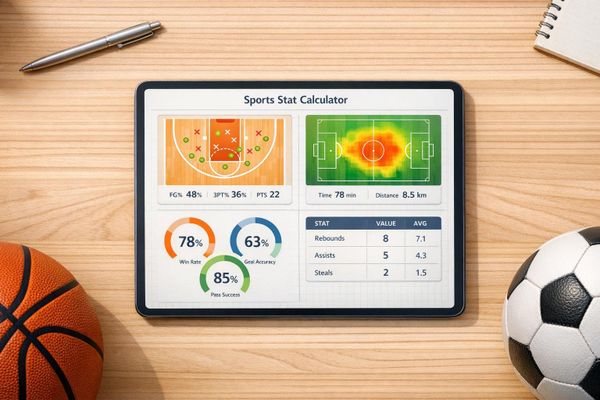
- Fan-facing platforms and analytics services aim to enhance fan engagement. They highlight games with high upset potential, track players nearing milestones (like a triple-double or 300-yard passing game), and offer interactive dashboards for exploring "what-if" scenarios. For example, StatPro showcases key player metrics - like receiving yards, touchdowns, and receptions - making it easier for fans to see how individual performances shape the game’s outcome.
Setting Up Your Real-Time Data Pipeline
Real-Time Sports Analytics Pipeline: From Data to Predictions
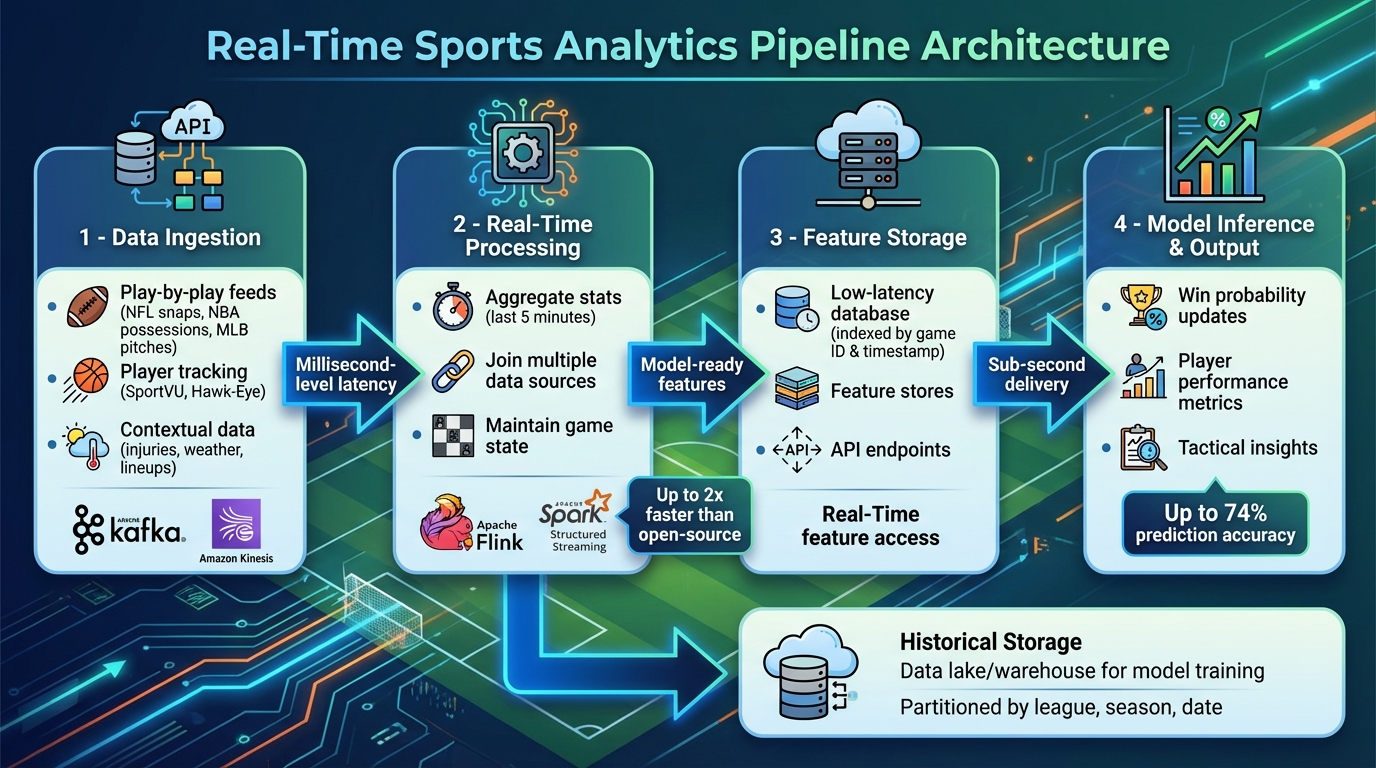
Designing a data pipeline to handle live game events in real time means building a system that collects, processes, and feeds data to your models without missing a beat - even during high-traffic moments like NFL Sundays. This requires a well-structured architecture capable of managing thousands of events per second.
Identifying and Organizing Data Sources
Start by identifying the data your prediction models need. The foundation comes from play-by-play feeds, which provide timestamped details like NFL snaps (down, distance, field position), NBA possessions (shot attempts, turnovers, fouls), or MLB pitches (count, base-out state, result). These feeds often come from official league sources or trusted providers. Next, add player tracking data from systems like SportVU or Hawk-Eye, which offer insights into positions, speeds, and distances - critical for assessing real-time tactical shifts. Complement these with contextual feeds such as injury reports, lineup changes, weather updates, and officiating assignments. For example, StatPro aggregates NBA scores, injury updates, and transaction news into a single analytics platform.
To ensure smooth integration, organize all data sources into a standardized catalog. Use consistent player IDs, team IDs, and game IDs across feeds, and align timestamps to Eastern Time for U.S. sports to avoid mismatches later. With your sources cataloged, you’re ready to build an efficient processing architecture.
Building the Streaming Architecture
A solid streaming pipeline has four main layers. The ingestion layer pulls live data through API connectors or WebSocket clients into a message broker like Apache Kafka or Amazon Kinesis, which acts as a central buffer. Schema registries keep event formats consistent, so downstream systems know what to expect. The stream processing layer is where the real work happens. Tools like Apache Flink or Spark Structured Streaming manage unbounded data streams, performing tasks like aggregating stats over the last five minutes, joining play-by-play data with tracking and injury updates, and maintaining game-specific states. Ververica's Flink-based platform, for instance, reports being up to twice as fast as open-source Flink, achieving millisecond-level latency - key for sportsbooks that adjust odds in real time.
The storage and serving layer stores recent game data in a low-latency database indexed by game ID and timestamp. This layer also uses feature stores or APIs to make model-ready features accessible. Lastly, raw data streams are compacted into a data lake or warehouse, partitioned by league, season, and date, for model training and backtesting. To keep the pipeline running smoothly, include monitoring, autoscaling, and checkpointing mechanisms to handle feed disruptions.
Once the pipeline is operational, the focus shifts to creating real-time features for your models.
Creating Real-Time Features
With data flowing through the system, the stream processor generates the features your models require. Game state features provide a snapshot of the current situation, such as score differential, time remaining, period or quarter, possession, and home/away indicators. For NFL games, include details like down, distance, field position (yards from the opponent’s end zone), timeouts left, and red zone status - key inputs for live win probability models. In the NBA, calculate metrics like pace (possessions per 48 minutes), offensive and defensive ratings over recent possessions, foul trouble for key players, and lineup strength based on on/off metrics. MLB features might include base-out state, ball-strike count, inning, pitcher fatigue proxies (pitch count, times through the order), and bullpen availability.
Beyond static data, compute rolling performance metrics. For example, track shooting efficiency over the last ten shots compared to the season average or calculate expected points added per play over the last drive. Use tracking data to derive player workload and fatigue metrics like total distance covered, high-intensity running (yards above a speed threshold), and the number of sprints or accelerations in recent periods. Lastly, quantify momentum with metrics like scoring runs (points scored without reply), win-probability shifts, and performance acceleration (recent success rate versus baseline). These features update dynamically after every play or possession, turning raw game events into actionable data for your prediction models.
Training and Deploying Your Prediction Models
Once your data is cleaned and structured, it's time to use it to create models capable of delivering fast, accurate game outcome predictions. This phase connects the dots between data preparation and real-time decision-making.
Choosing and Training Your Models
Start with logistic regression if you're looking for a quick and interpretable baseline for binary outcomes like win/loss or make/miss predictions. It works particularly well when you've developed features like score differential, time remaining, possession, or down and distance. Plus, its simplicity makes it easier to explain results to coaches, broadcasters, or product teams.
When the situation calls for capturing more complex relationships, consider gradient-boosted trees with tools like XGBoost, LightGBM, or CatBoost. These models excel at handling nonlinear interactions, such as how score margin and time remaining might influence outcomes differently in the fourth quarter compared to the first. They tend to outperform simpler models when you have a rich set of features, including lineup strength, recent scoring runs, and situational factors like injuries. For a balance between performance and reduced overfitting risk, random forests are a great option. If you're working with detailed sequence data from systems like SportVU or Hawk-Eye that track player movements multiple times per second, deep learning models such as RNNs or transformers may be the way to go.
To train your models, use multi-season historical data, incorporating play-by-play logs, box scores, player tracking data, injury reports, and betting lines. Divide your data chronologically - train on older seasons, validate on recent ones, and test on the latest season. This approach avoids learning from future games and mirrors real-world deployment conditions. StatPro's real-time statistics and insights can help streamline both the training process and live model inference.
When evaluating your models, focus on metrics like Brier score and log loss to assess prediction quality. However, pay special attention to calibration - use reliability plots to ensure predictions align with actual outcomes. For example, when your model predicts a 70% likelihood of an event, it should occur about 70% of the time over many games. This is especially important for applications like odds-making, live broadcast graphics, and risk management. Test calibration across different game scenarios - pregame, mid-game, and clutch moments - to ensure your model remains reliable in high-pressure situations.
Putting Models into Production
Once your model is trained, export it (e.g., as ONNX) and deploy it through a low-latency API that integrates with your live data stream processor. This setup ensures real-time updates, allowing predictions to flow seamlessly into live game data. For high-traffic events, implement autoscaling and partition game streams so predictions can run in parallel, maintaining sub-second latency from data ingestion to updated probabilities.
To keep inference fast, precompute computationally expensive features offline. Metrics like team strength or season-long player stats can be calculated between games and updated only during breaks, such as at the end of quarters or periods. By caching these values, your system can focus on dynamic features like current score margin or possession during live play. For in-play odds updates, you might simplify a large ensemble model into a smaller gradient-boosted tree or even a penalized logistic regression to prioritize speed over minor accuracy gains when milliseconds count.
Ongoing monitoring is key. Track latency, accuracy, and calibration, and set up alerts for drift - when predictions deviate from expectations, often due to rule changes, roster updates, or issues with data feeds. Establish an MLOps pipeline to automate data ingestion, retrain models regularly, and A/B test new versions against the current production models. This approach ensures your models stay effective as team strategies and player rosters shift throughout the season.
Applying and Understanding Predictions
Once your models are in action, the real challenge lies in making those predictions meaningful for the people who need them most. A 68% win probability doesn’t mean much if coaches can’t interpret why the odds shifted or if broadcasters struggle to explain its importance during a live game.
Making Predictions Easy to Understand
For predictions to resonate, they need to be presented clearly. Include probabilities alongside uncertainty ranges (e.g., "Team A: 68% win probability ± 7%") to emphasize that these results aren’t absolute. Confidence labels and short explanatory notes can help clarify why probabilities shift in real time.
Visual tools are incredibly effective in simplifying complex models. For example, win probability line charts can illustrate how momentum changes throughout a game. On-screen overlays can highlight key moments, such as "Team A's win probability dropped from 72% to 55% after that turnover", making it easier for broadcasters to weave analytics into their commentary. Fans, on the other hand, might connect better with simpler visuals like gauges, bar charts, or concise captions such as "Mismatch on the left side increases touchdown odds this drive."
The level of detail should always match the audience. Coaches and analysts might need in-depth tactical breakdowns, scenario simulators (e.g., "go for it on 4th down vs. punt"), and insights into factors like player matchups or fatigue. Broadcasters benefit from quick, story-friendly stats they can share in seconds. Meanwhile, fans and sports bettors prefer straightforward probabilities with just enough context to keep things engaging.
By making predictions clear and accessible, you set the foundation for using them in real-time sports decision-making.
Using Predictions in Sports Operations
Once predictions are presented clearly, they can be integrated into tools that support real-time decision-making. For coaching staffs, this means embedding win probabilities and expected points into video analysis systems or play-calling tablets. These tools can feature presets for common scenarios, like 4th-down decisions in the NFL or late-game fouling strategies in the NBA. Pre-game and in-game decision sheets - such as a single-page "keys to the game" summary - can highlight critical matchups, rotation strategies, and benchmarks (e.g., "Maintain a defensive rebounding rate above 72% to keep win odds above 60%"), helping teams plan more effectively.
In U.S. sports, data-driven models have already proven their worth. NFL teams, for instance, use them to gain an edge on 4th-down plays and 2-point conversions over a season. The same logic applies across leagues like the NBA and MLB, where real-time predictions guide pivotal in-game adjustments.
Broadcasters, meanwhile, should treat predictions as storytelling tools rather than dry technical data. Display win probabilities or expected goals only at decisive moments - like after turnovers, big plays, or power plays - so commentators can explain shifts in plain language. For example, a simple time-series chart could show, "At halftime, this team had a 9% chance to win; now it’s 57%." Training commentators to translate numbers into relatable terms, such as "about 3 out of 4 times, teams win from this position", helps maintain credibility while avoiding overstatements.
For fans, predictions can become an interactive and personalized layer of the game experience. Platforms can offer live updates for a user’s favorite NFL, NBA, or MLB teams, including win probabilities, in-game player stats, or updated playoff odds. Push notifications during major game moments can keep fans engaged. Allowing users to toggle scenarios - like "What happens if our QB throws 40+ times?" - makes the data feel more tangible and fun. Platforms like StatPro already blend real-time stats with advanced insights, offering features like live MVP odds or clutch performance projections that deepen fans’ understanding and enjoyment of the game.
Conclusion
Streaming analytics takes static forecasts and replaces them with continuous, real-time updates. With well-tuned models boasting over 70% accuracy, this technology isn’t just about calling winners - it’s about delivering insights into expected value, tactical trade-offs, and in-game risks as they unfold.
For teams and coaches, this means smarter decisions in the heat of the moment, whether it’s a crucial fourth-down call or adjusting lineup rotations. Broadcasters can elevate their storytelling with live win probability charts and expected points, while fans enjoy interactive dashboards that simplify complex data, making the game even more engaging. This evolution opens the door for advanced platforms to seamlessly deliver these insights.
Take StatPro, for example. It integrates live play-by-play feeds, tracking data, and contextual details to generate instant win probabilities, player impact scores, and team rankings. Whether you’re a fan checking stats on your phone, an analyst diving into possession-level metrics, or a coach reviewing decision sheets mid-game, the insights are tailored to fit your needs - formatted for U.S. conventions and delivered in seconds.
This real-time data revolution doesn’t just sharpen tactical choices; it transforms how we experience and engage with the game. Moving from post-game reports to dynamic, in-the-moment intelligence encapsulates the true power of streaming analytics. Predictions now evolve with real-time factors like injuries, weather changes, and tactical shifts, offering everyone - from front offices to casual fans - a clearer, data-driven view of the action.
FAQs
How does streaming analytics predict game outcomes in real time?
Streaming analytics takes the excitement of live games to a whole new level by predicting outcomes in real time. By analyzing live data - like player movements, team strategies, and critical game events - on the fly, it identifies patterns and trends that can forecast results as the game plays out.
Tools such as StatPro provide real-time stats and insights, sharpening the precision of these predictions. They also offer a closer look at player performance and team dynamics, giving fans and analysts a richer understanding of the game.
How do coaches and analysts use streaming analytics during games?
Coaches and analysts use streaming analytics to make sense of real-time data, enabling them to make swift, well-informed decisions during games. By diving into live stats and spotting trends as they happen, they can tweak strategies on the spot, fine-tune player performance, and sharpen the accuracy of their game predictions.
This reliance on data gives teams the flexibility to adapt to shifting game dynamics, offering a crucial advantage in high-stakes moments.
How does streaming analytics make watching games more exciting?
Streaming analytics takes the fan experience to a whole new level by providing real-time updates and predictive insights during games. Fans can dive into instant access to player stats, team rankings, and even predictions about game outcomes, turning every second into a more interactive and exciting experience.
By delivering live updates and in-depth analytics, viewers get a richer understanding of the game as it happens. This creates a more engaging and immersive way to enjoy sports, making every play and decision on the field even more thrilling.