
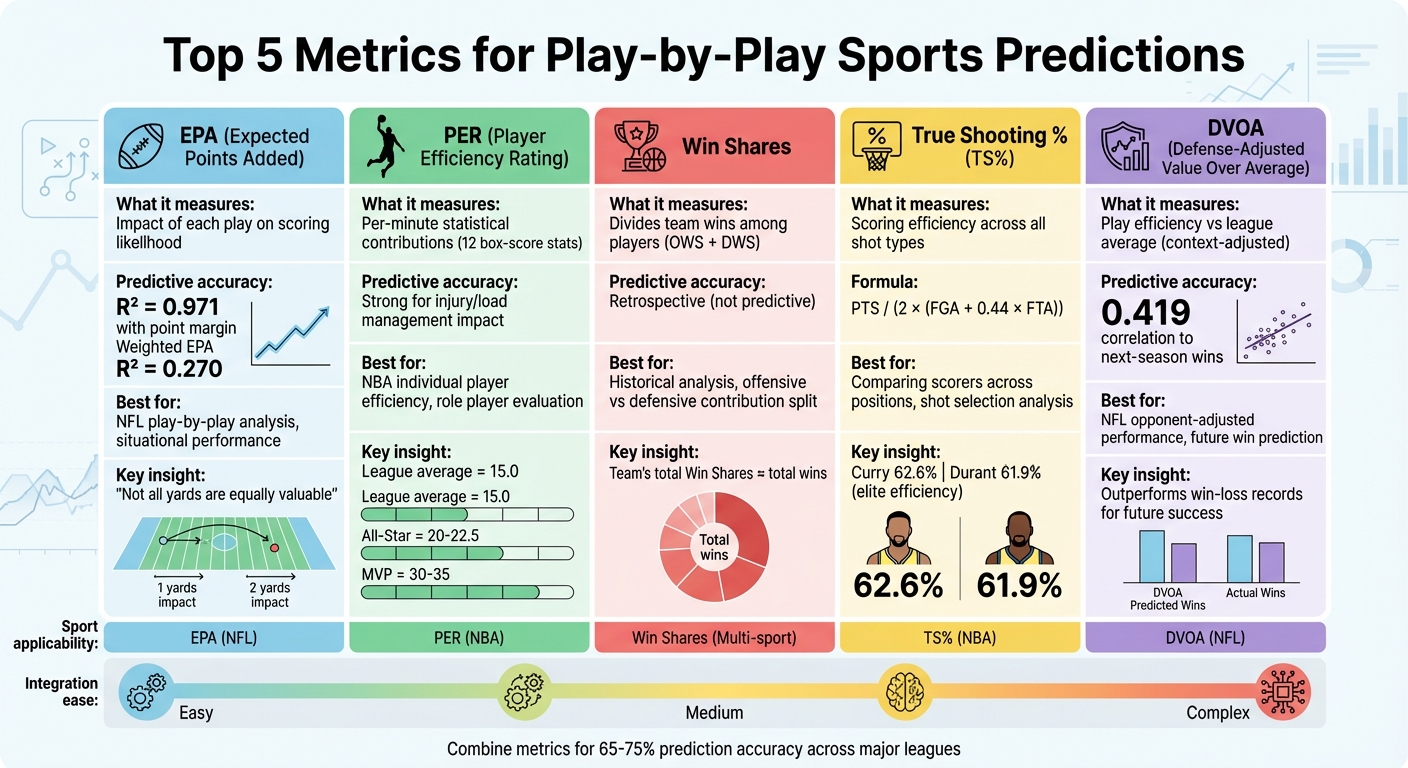
Top 5 Metrics for Play-by-Play Sports Predictions
Play-by-play metrics prove EPA, PER, Win Shares, TS% and DVOA reveal true efficiency and unlock more accurate sports prediction models.
When it comes to predicting sports outcomes, focusing on play-by-play efficiency offers a deeper, more accurate analysis than traditional stats. Metrics like Expected Points Added (EPA), Player Efficiency Rating (PER), and DVOA evaluate performance based on context, such as down, distance, and opponent strength. These tools help identify key contributors, predict regression, and refine predictive models.
Here’s a quick breakdown of the top metrics:
- EPA (Expected Points Added): Measures the impact of each play on scoring.
- PER (Player Efficiency Rating): Summarizes individual player contributions per minute.
- Win Shares: Assigns team wins to players based on performance.
- True Shooting Percentage (TS%): Evaluates scoring efficiency by factoring in shot types.
- DVOA (Defense-Adjusted Value Over Average): Compares plays to league averages with situational adjustments.
Each metric offers unique insights into efficiency, player impact, and team performance, making them essential for building accurate sports prediction models.
Top 5 Sports Prediction Metrics Comparison Chart
Top NFL Betting Metrics You Should Be Using (Stop Using Bad Stats!)
1. Expected Points Added (EPA)
Expected Points Added (EPA) measures the impact of each play by determining how it changes a team's likelihood of scoring. Before the snap, every situation has an expected point value, which shifts after the play is completed. The difference between these values is the EPA. This approach provides a detailed way to evaluate performance, play by play.
What makes EPA stand out is its ability to show that not all yards are equally valuable. Take this example: a 2-yard gain on 3rd-and-1 converts a first down and keeps the offense moving, resulting in positive EPA. However, the same 2-yard gain on 3rd-and-10 ends the drive, leading to negative EPA.
"EPA is the granular, play-by-play version of what wins the game." - Alok Pattani, ESPN Stats & Information Group
Predictive Accuracy
EPA isn't just a descriptive tool - it’s tightly linked to actual scoring outcomes. A team's total net EPA per play has an R² correlation of 0.971 with point margin. Compare that to traditional yardage statistics, where leading in total yards translates to a win in fewer than 70% of NFL games.
When adjusted for randomness - discounting unpredictable events like non-sack fumbles or plays during garbage time - Weighted EPA achieves an out-of-sample R² of 0.270, slightly outperforming DVOA's 0.263. This refinement filters out noise while retaining the most reliable signals.
Granularity of Insights
One of EPA's strengths is its ability to break performance down to the play level. It allows for detailed analysis of specific situations, such as separating pass EPA from rush EPA, evaluating red-zone efficiency, or assessing third-down conversions. For instance, a 60-yard pass to the 1-yard line might generate 5.7 EPA, while the subsequent 1-yard touchdown run adds much less - accurately reflecting the bigger contribution of the long pass to the scoring drive. This level of detail helps sharpen predictive models by clearly identifying which plays drive success.
EPA also quantifies individual contributions, estimating how many points a player adds compared to an average player. To get an even clearer picture, you can pair EPA with Success Rate - the percentage of plays with positive EPA. This combination highlights players who consistently perform well versus those who rely on occasional explosive plays.
Ease of Integration into Models
Because EPA is normalized on a per-play basis, it naturally accounts for differences in play volume between teams, making it easy to integrate into predictive models. Its stability and flexibility allow it to fit seamlessly into regression analyses or machine learning algorithms.
If you're building your own models, consider a few key adjustments. For example, discount defensive EPA, as defensive performance tends to be less stable over time compared to offensive performance. Additionally, filter out plays in garbage-time situations by using win probability metrics. These refinements can boost your model’s accuracy, improving its R² from 0.24 to 0.27 - an important step forward in predictive sports analytics.
2. Player Efficiency Rating (PER)
Player Efficiency Rating (PER) boils down a player's statistical contributions into a single per-minute metric. Created by John Hollinger, this system pulls data from 12 different box-score stats - like field goals, free throws, assists, rebounds, blocks, and steals - while deducting negatives such as missed shots, turnovers, and fouls. Much like EPA's play-by-play insights, PER focuses on individual efficiency.
"The PER sums up all a player's positive accomplishments, subtracts the negative accomplishments, and returns a per-minute rating of a player's performance." – John Hollinger, Creator of PER
Predictive Accuracy
Thanks to its detailed statistical approach, PER provides solid predictive insights. It’s especially useful for evaluating the effects of injuries and load management, as it measures a player's efficiency on a per-minute basis. This makes it easier to assess the value of role players. Take the 2019–20 NBA season, for example: Los Angeles Clippers center Ivica Zubac recorded a PER of 21.75, slightly edging out his star teammate Paul George's 21.14. This suggests Zubac’s absence could have a bigger impact on betting lines than one might assume at first glance. PER also helps determine whether a substitute can keep up the same level of efficiency.
Granularity of Insights
One of PER's strengths is its ability to adjust for game pace and playing time. This means players on slower-paced teams aren’t penalized for fewer possessions, and a bench player who plays just 15 minutes a game can still be fairly compared to a starter logging 35 minutes. The league average is reset to 15.00 each season, offering a stable benchmark.
Here’s how PER typically breaks down:
- A PER of 20.0–22.5 signals a borderline All-Star.
- A PER of 30.0–35.0 is reserved for MVP-level performances.
However, PER isn’t without flaws. It treats all stats equally, so a block in the first quarter is weighted the same as a game-saving defensive stop. It also doesn’t differentiate between assisted and unassisted field goals, which can limit its depth.
Ease of Integration into Models
The standardized 15.00 baseline simplifies PER’s inclusion in historical models, making it easier to compare player value across different eras. Since it already adjusts for playing time, there’s no need for extra tweaks when building regression models or machine learning algorithms. That said, PER leans heavily on offensive stats, and its defensive proxies can sometimes misrepresent a player’s true defensive contributions. For a more balanced analysis, pairing PER with defensive-specific metrics or True Shooting Percentage can help capture both efficiency and shot selection. When combined with tools like EPA, PER enhances predictive models by highlighting individual efficiency within the broader game context.
3. Win Shares
Win Shares is a metric designed to divide a team's total wins among its players based on their offensive and defensive contributions. Originally developed by Bill James for baseball, this concept was later adapted for basketball by Justin Kubatko. Essentially, the total Win Shares for a team will align closely with its total wins - so if a team wins 50 games, the combined Win Shares of its players will also be about 50.
Predictive Accuracy
While Win Shares is great for summarizing past performance, it’s not a tool for predicting future success. It focuses on what a player contributed to their team's wins rather than assessing their actual skill level. Studies have shown that there can be significant gaps between a player’s Win Shares and their team’s actual wins.
Granularity of Insights
Win Shares is broken down into two components: Offensive Win Shares (OWS) and Defensive Win Shares (DWS). This split helps identify whether a player’s impact is stronger on offense or defense. OWS is calculated using stats like "points produced" and offensive possessions, while DWS relies on a player's Defensive Rating, which estimates points allowed per 100 possessions. To make comparisons fair across players with varying playing times, Win Shares can be normalized per 48 minutes (WS/48). For context, Kareem Abdul-Jabbar holds the single-season NBA record with 25.4 Win Shares during the 1971–72 season. This detailed breakdown not only highlights individual contributions but also complements other metrics like True Shooting Percentage for a more complete picture.
Cross-Sport Applicability
The concept of Win Shares has been adapted for other sports as well. In baseball, one win equals three Win Shares, with hitters typically accounting for 48% of the total and pitchers/fielders making up the remaining 52%. Similarly, the NHL uses a metric called "Point Shares", where one standings point equals one point share. Because Win Shares relies on standard box-score stats, it’s particularly useful for historical analyses where advanced tracking data might not be available. However, when comparing across sports, it’s crucial to consider the specific context and nuances of each game.
Ease of Integration into Models
Since Win Shares is based on standard box-score data, it’s relatively straightforward to integrate into historical analyses. That said, one limitation is that players on teams exceeding their expected wins (calculated using the Pythagorean expectation) may end up with inflated Win Shares that don’t reflect their true contributions. Combining Win Shares with metrics like EPA or True Shooting Percentage can help create a more balanced and accurate model.
4. True Shooting Percentage
True Shooting Percentage (TS%) is a metric designed to measure scoring efficiency by factoring in the varying values of different shot types. The formula for TS% is: PTS / (2 × (FGA + 0.44 × FTA)). Unlike traditional field goal percentage, which treats all shots the same, TS% recognizes that three-pointers are worth more than two-pointers and also includes free throw attempts - an element often ignored by FG%. Much like how EPA and PER evaluate situational and player efficiency, TS% focuses specifically on scoring quality, offering a sharper lens for analyzing offensive performance.
Predictive Accuracy
TS% is a strong indicator of offensive success because it captures the true value of every scoring opportunity. When used in regression models to predict game outcomes, point totals, or betting spreads, TS% often highlights inefficiencies in the market. For example, Stephen Curry's career TS% of 62.6% and Kevin Durant's 61.9% underscore their status as two of the most efficient scorers in NBA history.
Granularity of Insights
This metric excels at differentiating between players who score in high volume and those who score with high efficiency. Take Klay Thompson, for instance: his 47% FG improves to 59.7% TS% due to his heavy reliance on three-pointers. Meanwhile, DeMarcus Cousins' 45.1% FG only translates to 53.8% TS%, even with his frequent trips to the free throw line. As Avi Goldman from The Ticket explains:
"TS% is much more helpful when I'm comparing players that play different positions because it attempts to control for the different types of shots that players take and the positions they play".
This level of insight is crucial for detailed analysis, especially when determining not just where a shot is taken but who is taking it.
Ease of Integration into Models
TS% is calculated using basic box score stats - points, field goal attempts, and free throw attempts - making it easy to incorporate into real-time play-by-play models. The 0.44 coefficient for free throw attempts adjusts for scenarios like "and-1" plays, where a possession isn't fully consumed, providing a more nuanced view of possession usage. Its simplicity and reliance on widely available data make TS% a valuable addition to broader metrics used in predictive modeling.
5. DVOA (Defense-Adjusted Value Over Average)
DVOA, or Defense-Adjusted Value Over Average, evaluates each play against a league-average baseline. This baseline is defined by factors like down, distance, field position, time left in the game, and the quality of the opponent. Unlike traditional stats that treat all yards equally, DVOA assigns contextual "success points". For example, gaining 8 yards on 3rd-and-10 is worth 0.54 success points, but the same 8 yards on 3rd-and-2 earns a full success. This situational focus gives DVOA its predictive edge.
Predictive Accuracy
DVOA consistently outperforms win-loss records in predicting future success. For instance, DVOA v8.0 showed a correlation of 0.419 to next-season wins, an improvement over earlier versions' 0.402 correlation. A good example is the 2016 Houston Texans, who made the playoffs with a 9-7 record but ranked 29th in DVOA. Meanwhile, the Philadelphia Eagles, who won just seven games, ranked 4th in DVOA. The Texans regressed the following season, while the Eagles improved, validating DVOA's predictive capability. Bill Barnwell sums it up well:
"DVOA also does a better job of correlating with winning in the future than a team's win-loss record itself".
To improve accuracy during the early season, the "DAVE" metric (DVOA Adjusted for Variation Early) combines preseason projections with current-season data, compensating for the smaller sample size.
Granularity of Insights
DVOA goes beyond basic stats by measuring play efficiency in specific contexts, such as the yardage needed for a first down. It adjusts for variables like down, distance, field position, time remaining, and score. It can also break down performance into categories like red zone or third-down efficiency. In September 2023, Aaron Schatz introduced DVOA v8.0, which made key updates: turnovers are now weighted at 75% of their previous value, and red zone bonuses were removed. These changes were designed to better align DVOA with future win correlations.
Ease of Integration into Models
One limitation of DVOA is its proprietary nature. It relies on detailed play-by-play data and cannot be calculated from a simple box score. Aaron Schatz explains:
"One of the issues with DVOA is that it is proprietary. I have to calculate it, nobody else has the equations and baselines. It's not the kind of thing that's easy to add up from a box score".
Despite this, DVOA remains a valuable tool for NFL predictive models. Weighted DVOA, which emphasizes recent games, provides a clearer picture of a team's current performance, making it especially useful for mid-season analysis. The metric also boasts strong year-over-year consistency, with a correlation of 0.457 to itself.
How to Use These Metrics in Your Models
To make the most of these metrics, start by gathering the right data. For NFL analysis in R, the nflfastR package is a great option - it includes play-by-play data with pre-calculated EPA values. If you're working with large datasets, enable parallel processing (e.g., with future::plan) to save time. Python users can rely on tools like scikit-learn for creating baseline models and libraries like XGBoost or LightGBM for ensemble stacking. Both R and Python provide powerful resources for predictive modeling, laying the groundwork for refining your models.
To enhance your predictions, combine raw metrics with opponent strength and situational filters. As Zach Bradshaw, an Analytics Developer at ESPN, points out:
"EPA is at the foundation of most advanced football analysis. Unlike other sports such as basketball, scoring points in the NFL is the cumulative result of many previous plays".
When focusing on quarterback impact, consider adding an aging curve to account for young players improving and older players declining. Adjust team ratings dynamically if a starting quarterback is replaced by a backup.
Normalization is key for fair comparisons. Always use EPA on a per-play basis (EPA/Play) to address differences in total plays. Standardize continuous metrics with Z-score normalization to prevent features with larger numerical values from overshadowing others. These standardized metrics form the backbone of advanced ensemble models that boost predictive accuracy.
For the best results, consider ensemble methods, which combine multiple models for improved accuracy. Advanced sports prediction models using AI often achieve 65–75% accuracy across major leagues, far better than casual fan predictions, which average 52–58%. NBA predictions are typically more accurate (67–72%) than NFL (65–70%) or soccer (55–65%) due to the reduced randomness in higher-scoring games. Tools like StatPro simplify this process by offering real-time stats and analytics for leagues like the NFL, NBA, and MLB. Their Pro plan, priced at $9.99/month, delivers advanced analytics and player stats that seamlessly integrate into your workflow.
To add more depth, pair EPA with Success Rate for context - a 5-yard gain might be a success on 1st-and-10 but a failure on 3rd-and-10. When possible, incorporate biometric data like Heart Rate Variability (HRV) from wearables. This provides a more accurate measure of player fatigue than relying solely on rest days.
Conclusion
Play-by-play metrics have transformed sports forecasting into a precise, data-driven science. EPA measures situational value, PER and Win Shares assess individual contributions, True Shooting Percentage evaluates scoring efficiency, and DVOA accounts for opponent strength. Together, these metrics create a well-rounded framework for analyzing both team performance and player impact. As Winner12 points out, these tools serve as the backbone of dependable sports forecasts. By combining these elements, analysts can build stronger, more accurate predictive models.
The real advantage comes from blending metrics to minimize bias. For instance, a team might rack up impressive total yardage but perform poorly in predictive stats like EPA or DVOA, signaling inefficiencies in execution. Models that incorporate these advanced metrics consistently deliver better accuracy across major sports leagues. In lower-scoring games like soccer, the challenge of evaluating players is heightened by the rarity of key events like goals. As Soccerment Research explains, "our evaluations of players' performance can easily be skewed by rare occurrences of valuable events such as goals". This is why metrics focused on processes, rather than just outcomes, tend to yield more reliable predictions.
Platforms like StatPro make it easier than ever to work with these advanced metrics. Their Pro plan, priced at $9.99 per month, offers real-time statistics and detailed analytics for the NFL, NBA, and MLB. Whether you're analyzing EPA trends during a live game or comparing defensive DVOA across matchups, StatPro provides instant access to the data you need. This eliminates the hassle of manual data collection and allows you to focus on building actionable predictive models.
For example, tracking deviations in metrics like Success Rate versus win-loss records can help you spot regression opportunities. Comparing offensive efficiency against opponent-adjusted defensive performance reveals key matchup dynamics before the game even begins. By combining normalized, contextualized data with real-time feeds, you can create prediction models that consistently outperform traditional box-score analysis. StatPro's tools empower you to seamlessly integrate these metrics and take your forecasting to the next level.
FAQs
What is Expected Points Added (EPA), and how does it enhance sports predictions?
Expected Points Added (EPA) is a metric widely used in sports analytics to gauge how much a specific play influences a team's likelihood of scoring. It works by comparing the expected points before and after a play, offering a clear picture of its impact on the game.
EPA brings a sharper lens to player performance, play efficiency, and strategic decisions. By breaking down how individual plays shape the game's outcome, it helps uncover patterns, assess decision-making, and refine predictions about future performance. This makes it an invaluable tool for analyzing the game on a play-by-play basis.
What are the drawbacks of using Player Efficiency Rating (PER) in play-by-play sports predictions?
Player Efficiency Rating (PER) is a well-known metric for assessing individual player performance, but it comes with some notable limitations, especially when used in predictive models. One major issue is its heavy emphasis on offensive stats, which often means defensive contributions and team-oriented play are overlooked. This can result in a skewed or incomplete understanding of a player's overall impact on the game.
Another shortcoming of PER is its inability to consider the context of a player's performance. It doesn't factor in elements like the strength of the opposing team or the specific game situation. Because of this, it may not always capture how well a player performs in high-pressure or critical moments. While PER can serve as a helpful tool, relying solely on it for predictions could lead to less reliable results.
What is True Shooting Percentage (TS%) and how does it help evaluate player performance?
True Shooting Percentage (TS%) gives a deeper look into a player's scoring efficiency by accounting for all shot types - field goals, three-pointers, and free throws. Unlike traditional field goal percentage, TS% adjusts for the value of each shot type, offering a clearer picture of how well a player capitalizes on scoring opportunities.
This stat plays a key role in predicting game outcomes. A player with a high TS% can consistently contribute to their team's scoring, sustain momentum, and even tilt the game in their favor. On the flip side, a decline in TS% might point to fatigue or challenging defensive matchups, both of which can influence how a game unfolds.
With StatPro, TS% is tracked in real-time alongside other advanced metrics, offering instant insights into a player's shooting performance and its impact on game dynamics. When paired with team stats, it allows analysts to refine predictions and develop smarter strategies with greater precision.