Top 5 Zone Coverage Stats for NFL Teams
High-volume zone coverage is reshaping NFL defenses—revealing which schemes most effectively limit big plays, dominate red-zone results, and drive defensive efficiency.
Zone coverage is a critical strategy in football, where defenders protect specific areas rather than marking individual players. Here's what you need to know about the top zone coverage stats for NFL teams in 2025:
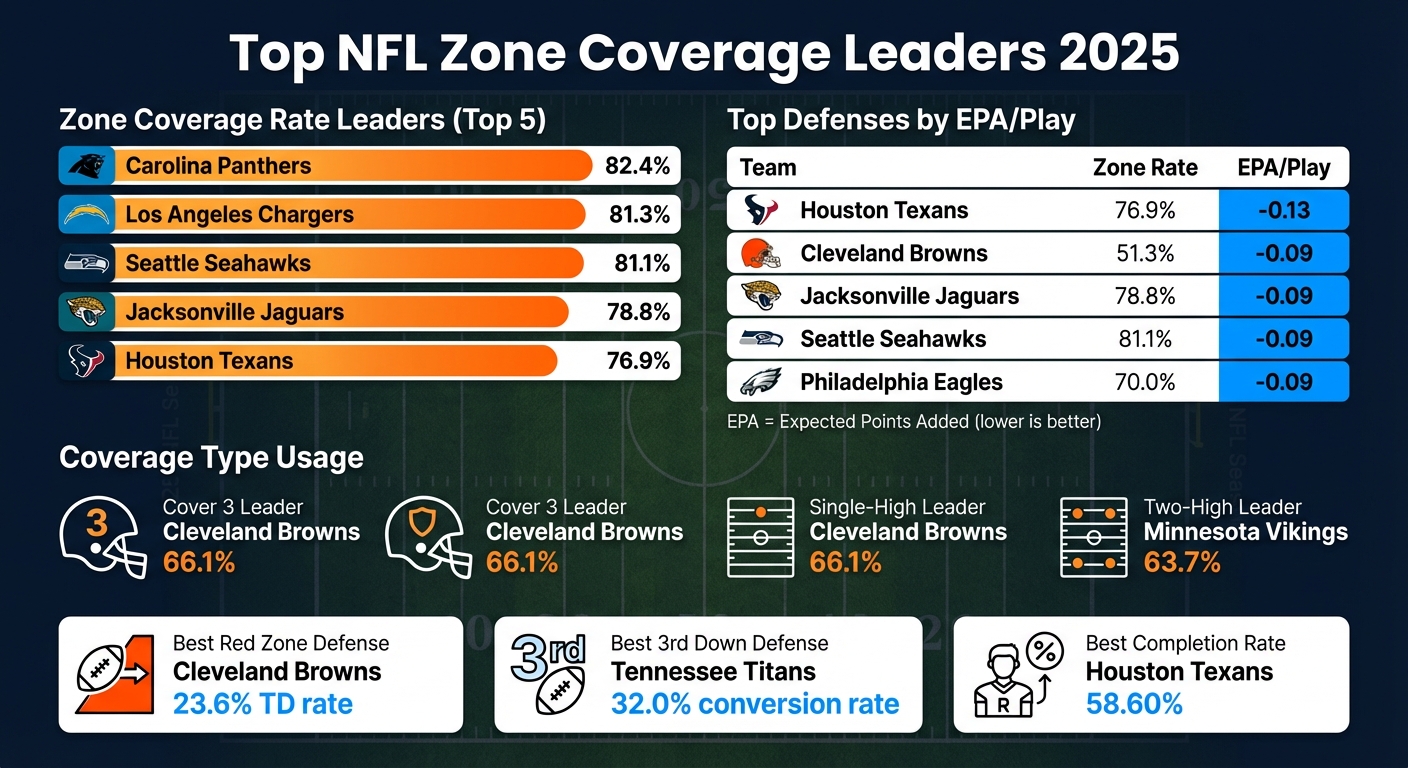
- Carolina Panthers lead with an 82.4% zone coverage rate, followed by the Los Angeles Chargers (81.3%) and Seattle Seahawks (81.1%).
- The Cleveland Browns, despite using zone on only 51.3% of plays, excel with the NFL's top man-to-man coverage rate (45.0%) and the best third-down conversion defense (33.3%).
- Cover 3 remains popular, with teams like the Browns employing it on 66.1% of snaps. The Falcons (63.3%) and Lions (60.3%) also heavily rely on this scheme.
- Single-high coverage is a favorite for the Browns (66.1%), aiding their league-best red zone defense (23.6% opponent touchdown rate).
- Two-high coverage is led by the Vikings at 63.7%, showing their focus on limiting deep passes.
Teams like the Texans and Seahawks pair high zone usage with top defensive efficiency, while players like Derek Stingley Jr. thrive by suppressing targets in their zones. Whether it's stopping big plays or forcing tough decisions, zone coverage continues to shape NFL defenses in 2025.
Top NFL Teams by Zone Coverage Rate and Defensive Efficiency 2025
AWS re:Invent 2025 - NFL Next Gen Stats: Decoding Defensive Coverage Using Transformer Architectures

1. Zone Coverage Rate
The zone coverage rate indicates how often defenses rely on area assignments rather than man-to-man coverage. This metric provides insight into a defense's overall strategy and philosophy.
As of December 2025, the Carolina Panthers top the league with an impressive 82.4% zone coverage rate, followed closely by the Los Angeles Chargers at 81.3% and the Seattle Seahawks at 81.1%.
Teams that lean heavily on zone coverage often deliver standout defensive performances. For example, four of the top five teams in EPA per play - the Texans (-0.13 EPA), Seahawks (-0.09 EPA), Jaguars, and Eagles (-0.09 EPA) - all use zone coverage on at least 70% of their defensive snaps. The Houston Texans are a prime illustration of this approach. Their 76.9% zone rate has propelled them to the league's best defensive efficiency, allowing just a 58.60% completion rate.
Zone coverage also shows its value in high-pressure situations like the red zone. The Vikings (42.55%), Broncos, Rams (46.81%), and Chargers (50.00%) - the top four teams in opponent red zone touchdown percentage - all maintain zone rates of 63.2% or higher. A standout example is Los Angeles Chargers rookie cornerback Tarheeb Still, who has thrived in this zone-heavy system. Through Week 8 of the 2025 season, he allowed just 0.5 yards per coverage snap and posted a -0.19 EPA per target, showcasing how zone schemes can support young players while maintaining strong defensive results.
On the other hand, the Cleveland Browns demonstrate that success doesn't require a zone-heavy approach. With a zone coverage rate of just 51.3% and a preference for man-to-man on 45.0% of plays, they have excelled in third-down situations. The Browns allow a league-best 33.3% third-down conversion rate and boast the top defensive success rate at 37.90%. Their aggressive man coverage works because of their highly skilled personnel, proving that there’s more than one way to achieve defensive dominance.
2. Cover 3 Usage Rate
Cover 3 is a zone defense that assigns one high safety to patrol the deep middle of the field while three defenders cover vertical zones. This scheme is a staple for teams that heavily rely on zone defenses, making it one of the most familiar setups in the NFL. The stats below highlight which teams lean most heavily on this approach.
Leading the league in Cover 3 usage are the Cleveland Browns, who employ it on an impressive 66.1% of their defensive snaps. They're followed by the Atlanta Falcons at 63.3% and the Detroit Lions at 60.3%. The Falcons, in particular, stand out with their 63.3% Cover 3 rate paired with a 75.5% overall zone usage, showcasing their reliance on this defensive structure. Rounding out the top five are the New Orleans Saints (59.4% Cover 3, 76.9% zone) and the New York Giants (59.3% Cover 3, 62.6% zone).
Interestingly, some teams are shifting away from heavy Cover 3 usage to diversify their defensive strategies. For instance, the Arizona Cardinals, under head coach Jonathan Gannon, transitioned in 2025 from a Cover 3–dominant scheme to one focused on Cover 4. That year, they reduced their Cover 3 snaps to just 27%, while Cover 4 slightly edged it out at 28%. This adjustment aligns with a growing league trend aimed at limiting explosive plays of 20+ yards, even if it means exposing defenses to intermediate gains.
On the flip side, teams like the Minnesota Vikings are less reliant on Cover 3, using it on only 31.2% of their defensive snaps. Instead, they favor "middle-open" coverages, such as Cover 2 and Cover 4, which they employ at a combined rate of 63.7%. Similarly, the Buffalo Bills (42.3% Cover 3) and the Cardinals (39.6% Cover 3) also lean toward middle-open schemes, signaling a preference for defensive flexibility over the traditional single-high Cover 3 setup.
3. Single-High Coverage Usage
Single-high coverage plays a pivotal role in how NFL defenses balance stopping the run and defending against deep passes. This setup features one safety positioned deep in the middle of the field, serving as the last line of defense. It’s a cornerstone of both Cover 1 (man coverage) and Cover 3 (zone coverage) schemes, allowing defenses to either load the box to stop the run or keep a safety deep to prevent big plays through the air. In 2025, NFL teams averaged a single-high usage rate of about 50.7%. This alignment not only shapes defensive strategies but also ties closely to red zone effectiveness and overall defensive consistency.
The Cleveland Browns lead the league in single-high usage at 66.1%, followed by the Atlanta Falcons at 63.3%, Detroit Lions at 60.3%, New Orleans Saints at 59.4%, and New York Giants at 59.3%. The Browns combine this high single-high rate with the league’s top man coverage rate of 45.0%, while the Falcons opt for a zone-heavy approach, with 75.5% of their plays in zone coverage. These contrasting styles show how the same alignment can be adapted to fit different defensive philosophies. Notably, the Browns’ heavy single-high usage contributes to their league-best red zone defense, allowing touchdowns on just 23.6% of red zone trips. On the flip side, the Vikings, who use single-high coverage only 31.2% of the time, allow a much higher red zone scoring rate of 32.3%.
Meanwhile, teams like the Arizona Cardinals (39.6%), Buffalo Bills (42.3%), and Kansas City Chiefs (42.6%) lean more on two-high safety shells to limit deep passing plays. The Los Angeles Chargers, with their zone-heavy scheme, also feature a relatively low single-high usage rate of 43.4%.
Beyond red zone performance, the Browns’ defensive dominance extends to the passing game, where they allow a league-best 69.9 passer rating. This demonstrates how, when executed effectively, single-high coverage can provide a strong mix of run support and pass defense, especially in high-stakes situations like the red zone.
4. Two-High Coverage Rate
The two-high coverage, also referred to as the "Middle Open Rate", positions two safeties deep to split the field, offering strong support against deep passes. This alignment makes it challenging for offenses to exploit the sidelines or seams with long throws. However, this setup can leave defenses more exposed to underneath routes and the run game compared to single-high coverage, which leans more toward run support.
Teams across the NFL vary widely in their use of two-high coverage. Leading the league are the Minnesota Vikings, employing this scheme on 63.7% of plays - about 10% more than the Kansas City Chiefs and Arizona Cardinals, both at 53.8%. Other notable teams include the Buffalo Bills (53.4%) and Los Angeles Chargers (52.4%), while the Cleveland Browns are at the opposite end, utilizing two-high just 32.8% of the time.
The impact of two-high shells is particularly evident in deep coverage stats. Take San Francisco 49ers cornerback Deommodore Lenoir, for example. During the 2025 season through October, he allowed zero completions on 10 targets beyond 16 air yards and recorded the second-fewest yards per coverage snap (0.5) among cornerbacks with at least 100 snaps. Similarly, Houston Texans cornerback Derek Stingley Jr. excelled in deep coverage, giving up only six receptions on 39 targets of 10+ air yards, resulting in a league-best 15.4% completion rate for any cornerback with 15+ such targets since 2018.
Two-high usage also plays a role in third-down and red zone performance, though results vary by team. The Vikings, who lead in two-high usage, allow a 33.1% third-down conversion rate and a 32.3% red zone touchdown rate. Meanwhile, the New York Jets, employing two-high on 49.6% of snaps, boast one of the league's strongest red zone defenses, allowing touchdowns just 28.5% of the time. On the other hand, some teams struggle in red zone defense despite heavy two-high usage - for instance, the Chargers allow a 33.9% red zone touchdown rate despite using two-high on 52.4% of their plays.
As of December 2025, the league shows a clear divide in philosophy: 11 teams use two-high shells on more than 50% of their snaps, while six teams remain below 40% usage. This contrast underscores the strategic differences in how teams approach defensive coverage.
5. Zone Coverage Success Rate
Zone coverage success rate measures how well a defense limits offensive production using key stats like Passer Rating vs. Zone, Yards per Attempt (Y/A) vs. Zone, Touchdowns Allowed vs. Zone, and EPA (Expected Points Added) per target. These metrics collectively paint a picture of how effectively a defense disrupts offensive plays.
In recent years, evaluation methods have evolved. Instead of focusing solely on plays where defenders are targeted, analysts now incorporate all-snap analysis. For instance, PFF's Advanced Coverage Grade uses machine learning to assess defenders on every single snap - even when they aren't directly involved in the play. This approach accounts for factors like assignment difficulty, coverage schemes, and safety rotations. As PFF explains:
"Incorporating information from non-targeted plays improves coverage metrics' stability and predictive power".
This broader analysis directly ties into performance in high-stakes situations, such as third downs and red zone defense.
For example, teams like the Tennessee Titans, who rely on zone coverage for 74.6% of their snaps, excel in third-down defense, allowing conversions just 32.0% of the time - the best in the league. On the other hand, the Cleveland Browns, despite using zone coverage on only 51.3% of their plays, dominate in red zone defense, allowing touchdowns on just 23.6% of opponent trips. The New York Jets balance a 61.5% zone usage with strong situational defense, permitting third-down conversions at 35.0% and red zone touchdowns at 28.5%.
Interestingly, heavy zone usage doesn’t always guarantee success. The Los Angeles Chargers, who run zone on a league-high 81.3% of their snaps, allow third-down conversions at a 47.2% rate - one of the highest in the NFL. Conversely, the Minnesota Vikings showcase efficiency among zone-heavy teams, allowing a league-second-best passer rating of 74.7. Their success comes from strategic use of two-high shell coverage on 63.7% of snaps, paired with effective pattern-matching techniques.
Beyond these advanced metrics, the concept of target suppression highlights another dimension of effective zone defense. Take Patrick Surtain II of the Denver Broncos, for instance. In 2025, quarterbacks targeted his zone on just 51.5% of opportunities - the second-lowest rate in the league. This "repelling" effect, where quarterbacks intentionally avoid certain areas of the field, reflects what analysts call "quiet wins." These plays, while not reflected in traditional stats like completion percentages, often serve as a more reliable measure of defensive success. By discouraging throws altogether, defenders can dictate the game in ways that don’t show up in the box score.
Comparison Table
Here's a breakdown of each team's zone coverage profile for the 2025 season.
Top Teams by Zone Coverage Rate (2025 Season)
| Rank | Team | Zone Coverage Rate | Middle Closed Rate | EPA/Play |
|---|---|---|---|---|
| 1 | Carolina Panthers | 82.4% | N/A | N/A |
| 2 | Los Angeles Chargers | 81.3% | N/A | N/A |
| 3 | Seattle Seahawks | 81.1% | 45.1% | -0.09 |
| 4 | Jacksonville Jaguars | 78.8% | 46.6% | -0.09 |
| 5 | Houston Texans | 76.9% | 53.9% | -0.13 |
| 6 | Philadelphia Eagles | 70.0% | 52.3% | -0.09 |
| 7 | Cleveland Browns | 51.3% | 66.1% | -0.09 |
Among these teams, the Panthers, Chargers, and Seahawks stand out as the only ones using zone coverage on more than 80% of their plays. The Texans, despite ranking fifth in zone usage, lead the league in defensive efficiency with an EPA/play of -0.13. Their defensive success is tied to a balanced approach, pairing a 76.9% zone rate with a 53.9% Middle Closed Rate. On the other hand, the Browns take a different route, relying on zone coverage for just 51.3% of snaps but achieving a 66.1% Middle Closed Rate.
Over the last few years, zone coverage has steadily gained popularity. Back in 2020, man coverage accounted for 30.8% of plays, but by 2023, that number had dropped to 24.0%, as defensive coordinators shifted their focus toward limiting big plays rather than sticking with aggressive man-to-man schemes. This trend continued into the 2025 season, with top defenses like the Seahawks (ranked #4 in EPA) and Jaguars (ranked #3 in EPA) both using zone coverage on more than 78% of their plays. These variations in zone strategies highlight the evolving tactics employed by successful defenses.
Below is another table showcasing the top defensive teams based on EPA/play, along with their coverage tendencies.
Top 5 Defenses by EPA/Play and Their Coverage Profiles
| EPA Rank | Team | Zone Coverage Rate | Middle Closed Rate | EPA/Play |
|---|---|---|---|---|
| 1 | Houston Texans | 76.9% | 53.9% | -0.13 |
| 2 | Cleveland Browns | 51.3% | 66.1% | -0.09 |
| 3 | Jacksonville Jaguars | 78.8% | 46.6% | -0.09 |
| 4 | Seattle Seahawks | 81.1% | 45.1% | -0.09 |
| 5 | Philadelphia Eagles | 70.0% | 52.3% | -0.09 |
The top defenses employ a variety of zone coverage strategies. The Texans and Seahawks lean heavily on zone schemes, while the Browns take a more balanced approach. Notably, top-performing defenses maintain Middle Closed Rates above 52%, which emphasizes the ongoing reliance on Cover 3–style concepts.
Conclusion
These five zone coverage metrics offer a clear window into evaluating NFL defenses. Zone Coverage Rate reveals a team's preference for area-based coverage over man-to-man schemes, helping to identify their overall defensive tendencies. Meanwhile, structural metrics like Middle Closed and Middle Open Rates shed light on a defense’s priorities - whether they lean toward bolstering run support or focusing on limiting big plays downfield. Efficiency metrics, such as Passer Rating and Yards per Attempt against zone coverage, provide a sharper measure of defensive effectiveness than simply looking at total yards allowed.
Standout players like Jamel Dean thrive in zone-heavy systems. In 2025, Dean achieved an astonishing passer rating of just 22.8 when targeted, the lowest for a cornerback in the past eight seasons. On a broader scale, teams like the Seahawks demonstrate how well-executed zone schemes can limit offensive production, as seen in their ability to minimize yards per target.
Tools like StatPro make it possible to monitor these evolving defensive trends in real time. Want to understand why the Carolina Panthers run zone on 82.4% of their snaps or why the Cleveland Browns stick with a 66.1% Middle Closed Rate? Accessing these metrics instantly helps uncover the reasoning behind matchup strategies and defensive adjustments.
The 2025 season has solidified the rise of high-volume zone coverage among elite defenses. As coordinators continue to adapt their tactics, real-time tracking of these metrics will remain crucial in redefining how defensive performance is analyzed.
FAQs
What’s the difference between zone coverage and man-to-man coverage in the NFL?
Zone coverage and man-to-man coverage are the two primary defensive strategies NFL teams rely on to counter the passing game. In zone coverage, defenders are tasked with guarding specific areas of the field rather than sticking to individual players. Their job is to react to any passes that enter their assigned zones. This strategy works well when there are multiple receivers in the same area, as it allows defenders to cover space rather than chase players. Teams are often assessed based on their zone coverage rate, which reflects how often they use this tactic during games.
On the other hand, man-to-man coverage assigns each defender to a specific offensive player. The defender shadows that player throughout the play, which can be physically demanding but is particularly effective for neutralizing key offensive threats. Since these two strategies focus on different aspects - zone coverage emphasizes guarding space, while man-to-man focuses on individual matchups - analysts use distinct metrics to evaluate their success. These measurements provide valuable insights into a team’s defensive strengths and weaknesses over the course of a season.
Why do some NFL teams prefer the Cover 3 zone defense over other schemes?
Teams frequently opt for the Cover 3 zone defense because it offers a solid mix of protection against deep passes while still providing support to stop the run. In this setup, three defenders are assigned to cover deep zones, which helps guard against long throws. Meanwhile, the rest of the defense focuses on covering shorter routes and stepping up to halt the run game.
The decision to implement Cover 3 often hinges on a team's defensive strengths. For example, fast cornerbacks are ideal for covering deep zones, while a strong safety who excels at tackling can be a key asset in run defense. Ultimately, the choice of this defensive scheme is shaped by a combination of the team's strategy, player abilities, and the specific challenges posed by their opponents.
How does zone coverage impact a team's defensive performance?
Zone coverage is a fundamental defensive tactic in the NFL where defenders focus on guarding specific areas of the field instead of tracking individual players. This strategy is designed to prevent big plays by keeping defenders aligned in a structured formation, often referred to as a "shell."
Teams that prioritize zone coverage tend to give up fewer explosive passing plays and excel in critical situations, such as red-zone defense and limiting points scored. By maintaining tighter spacing on the field, zone schemes can lower yards per pass attempt and boost overall defensive performance.
StatPro offers in-depth analytics on zone coverage rates, red-zone success, and other critical metrics, providing teams and analysts with valuable insights into how defensive strategies impact game results.